How the Social Security is financed
Social Security is a Pay-as-You-Go (PAYGO) system. It is a common misconception that Social Security acts like other investment/retirement accounts that individuals pay into and grow over time. Social Security instead relies on Payroll taxes from today’s workers to finance benefits for today’s retirees, survivors, and disabled workers. The Social Security Trust funds act as a small buffer, but long-run solvency depends mostly on the flow of contributions from current workers outpacing the flow of benefits to current recipients and not on a large pool of invested assets that many believe.
Workers vs. Beneficiaries – The Ratio Math Challenge
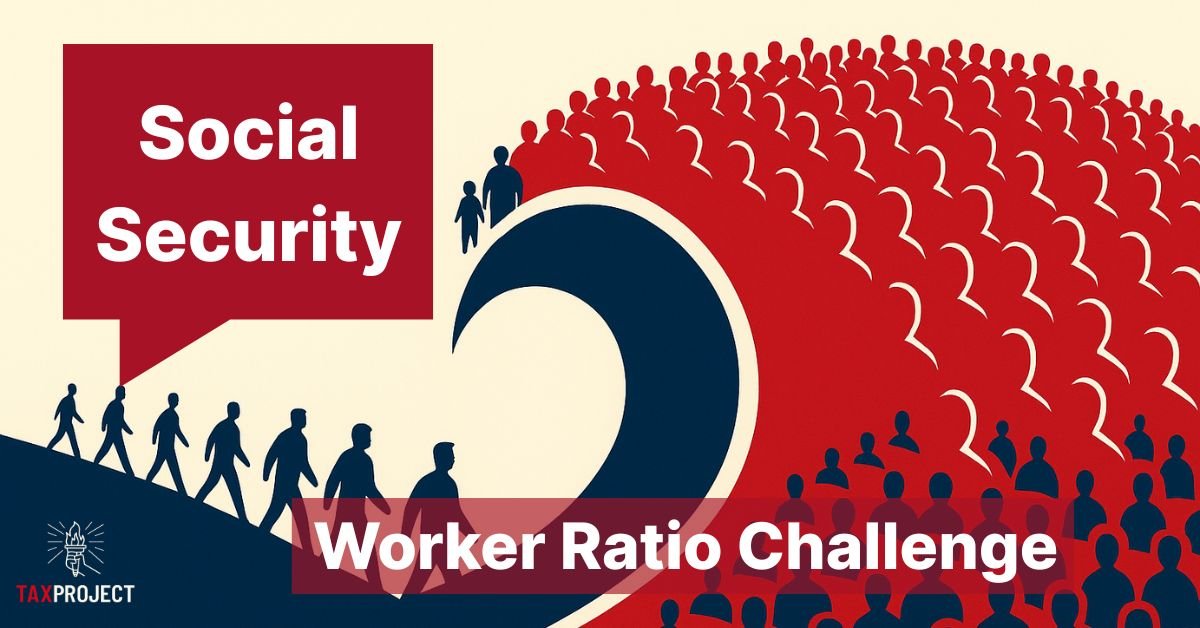
Because PAYGO relies on current payrolls, the program’s sustainability is tightly coupled to how many people are paying in relative to how many are receiving. In fact, the system requires several workers per beneficiary in order to keep up with current program expenses. The less workers per beneficiary, the more challenging the finances are for the entire program.
Key Social Security Metrics :
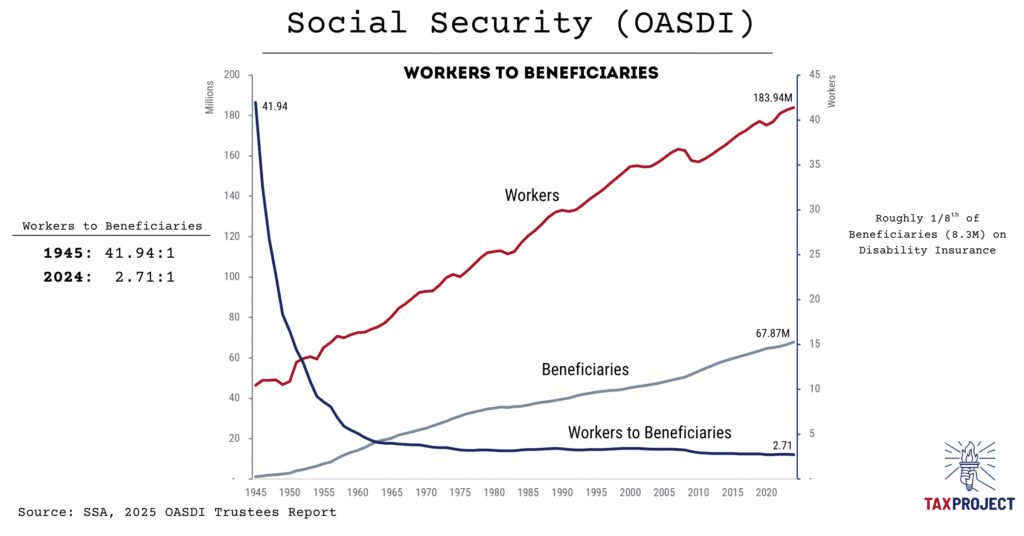
- Covered workers (Payers), 2024: ~184.0M
- Beneficiaries, 2024: ~67.9M
- Workers per beneficiary, 2024: ~2.71 : 1
- Workers per beneficiary, 1945: ~41.94 : 1
- Disability Insurance (DI) share, 2024: ~8.3M beneficiaries, ~1/8 of total OASDI
The chart (“Workers to Beneficiaries”) captures the same story: a steady rise in beneficiaries alongside a slower-growing base of covered workers, driving the ratio down from ~42 to ~2.7 over eight decades. Obviously, this is not a favorable trend for Social Security solvency.

Program Sustainability
In a PAYGO system, the ratio of Workers to Beneficiaries is critical – too few and the program runs into challenging finances that don’t work without altering the program. To maintain a steady state Revenue from Worker’s Payroll taxes must equal of exceed Payments to Beneficiaries.
Formula: (Payroll tax rate × Average covered wage × Number of workers) ≈ (Average benefit × Number of beneficiaries)
If wages and tax rates remain constant, a lower workers-to-beneficiary ratio means less revenue per beneficiary. This has long been the 3rd rail of politics that most policymakers do not want to touch – understandably, people who have worked a lifetime with a set of promises and expectations aren’t likely to be happy with reduced Payments, or higher Taxes. However, in order to keep balance, that is exactly what Policymakers must do if the number of workers per beneficiary drops. Policy Makers would be left with making tough decisions to pull one or more of these levers:
- Raise Taxes – This could be done with some combination of increases to tax rate, increases in taxable maximum, or greater enforcement.
- Reduce Benefits – This could be achieved by reducing benefits, increasing eligibility age, or across-the-board adjustments.
- Transfer Resources – This could be done by taking funds from other parts of the budget, and/or taking on more debt.
- Improve the Ratio – This would require adding Workers via higher labor-force participation or immigration or reducing Beneficiaries.
What’s been Changing
Social Securities has a number of long running challenges that are not easily overcome that challenge the program solvency and viability. At the end of the day, Social Security is backed by the full faith and credit of the United States, and its unlimited ability to Tax. So Social Security will not go away, but if these macro challenges are not resolved there will likely be changes to the program. Three long-running demographic forces explain most of the ratio’s decline:
- Population Aging: The cohort of younger workers is smaller than the cohort or near retirees lowering the ratio of workers to beneficiaries.
- Longevity Gains: People are living longer and beneficiaries are collecting for longer.
- Lower Fertility: Americans are having fewer children which means less new workers per retiree over time.
Some people use the saying Demographics is Destiny – and these challenges will put additional strain on Social Security viability. The Payroll Taxes for Old Age, Survivors, and Disability Insurance that funds Social Security (OASDI) also includes Disability Insurance (DI) that adds another dimension. With ~8.3M people on Disability Insurance (~12% of beneficiaries), disability incidence and program rules also affect total beneficiary counts and outlays. See our Article on Privatizing Social Security to see the Demographic, and Unfunded Liabilities Challenges.
Bottom line
Social Security (OASDI) works as designed when many workers support each beneficiary. As this ratio has continued to drop from ~42:1 (1945) to ~2.7:1 (2024) and as current Demographic and Longevity changes manifest this will compress Social Securities PAYGO margins, which is why the program’s long-term outlook likely hinges on policy choices that either raise taxes, reduce benefit growth, or find a way to increase the worker base. The mechanics are clear: sustainability is, above all, a Ratio Math problem.
References
[1] SSA, 2025 OASDI Trustees Report, Table IV.B3 “Covered Workers and Beneficiaries, Calendar Years 1945–2100” (historical rows used for 1945–2024).


