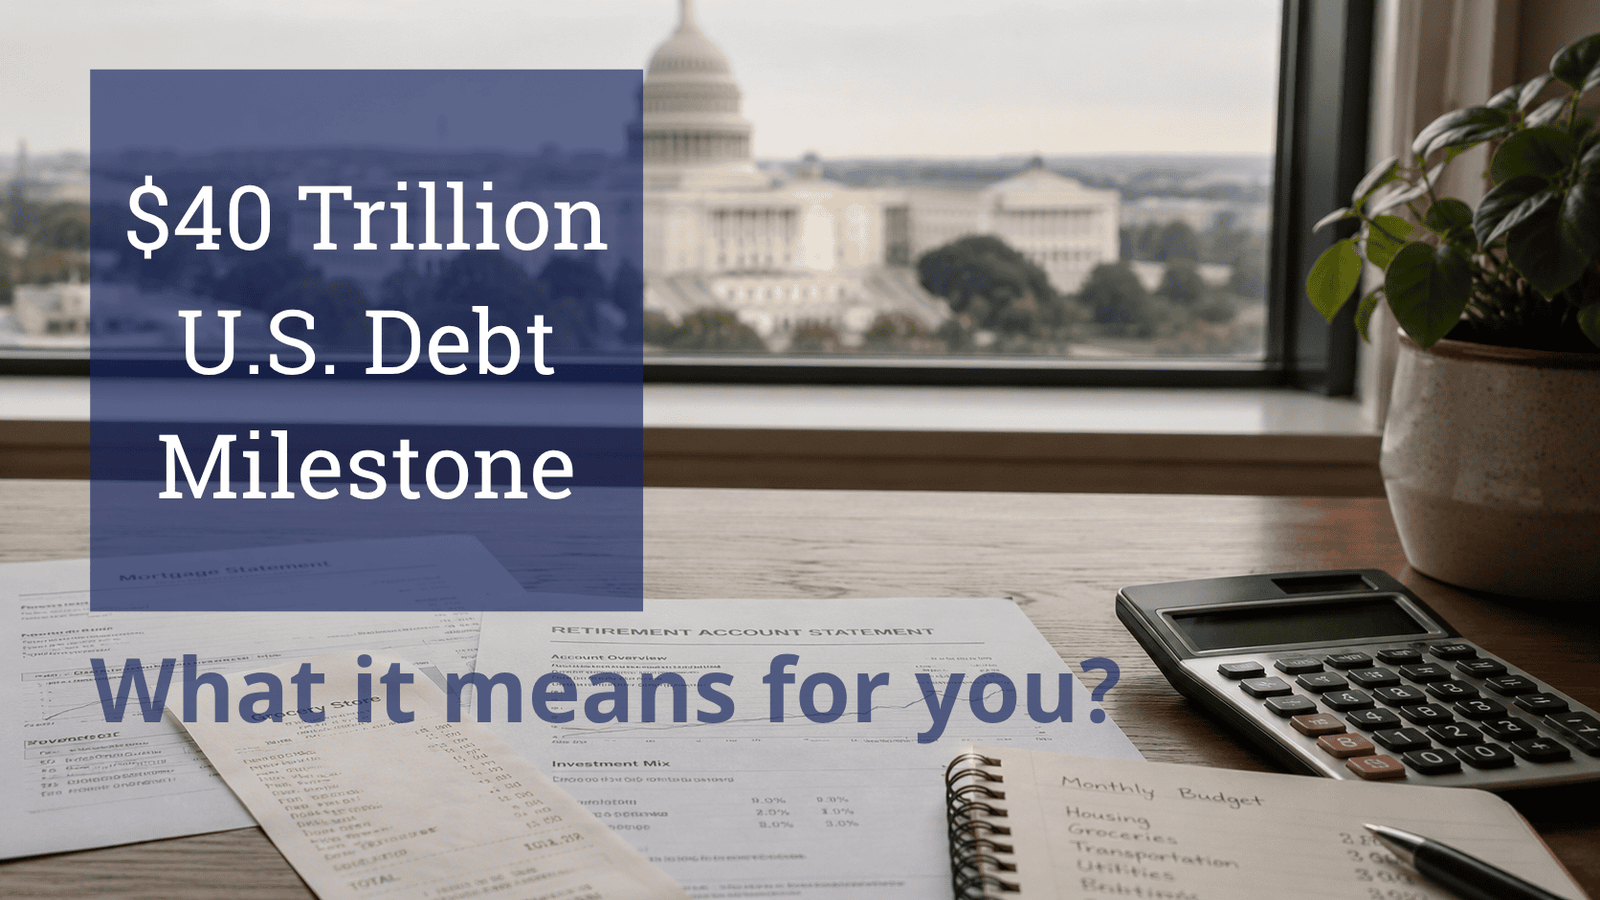
America’s national debt has crossed $40 trillion. You won’t receive a bill for your share, but a large and growing debt can still reach your household through the cost of living, interest rates, economic growth, taxes and government services, and through the country’s ability to handle the next crisis.
On August 18, 2026, the gross U.S. National Debt crossed $40 trillion for the first time. [1]
Another major milestone $40 trillion. However, crossing that line did not suddenly create a financial crisis. There is little economic difference between a national debt of $39.99 trillion and $40.01 trillion. Milestones are useful in that they give us an opportunity to reflect on what it all means to America and to us as individual citizens. It is a “How are we doing?” moment of self-reflection.
For most Americans, the national debt can seem distant from everyday life. For the most part, that is a good thing. It is a little like having your own credit and debt under control so that you do not have to think about them every day. Nobody receives an invoice for an individual share of the national debt. The federal government does not have to repay all $40 trillion tomorrow. And the United States remains a wealthy country with a large economy, deep financial markets and an exceptional ability to borrow.
All that said, not having to worry about debt immediately does not mean debt levels, understanding what they mean, and their trajectory do not matter.
The consequences of debt tend to arrive more indirectly for citizens. Even worse, the negative impacts as they get larger happen very slowly, then suddenly.
Over time, a large and persistently growing debt can affect:
The purchasing power of your money
What you pay to borrow
Economic growth, employment, and wages
Future taxes and government benefits
Savings and retirement assets
The country’s financial flexibility when the next emergency arrives
Debt is not the only force affecting any of these, and the outcomes are not inevitable. However, as the debt and the cost of carrying it increase, the risks and challenges become harder to ignore.
What Does the $40 Trillion Actually Represent?
The headline $40 trillion figure is Gross Federal Debt. It includes Treasury debt held outside the federal government as well as Treasury securities held by federal government accounts. [1]
For many economic questions, economists focus more closely on debt held by the public because that represents federal borrowing from financial markets and is the portion most directly connected to interest rates and private investment. [1][2]
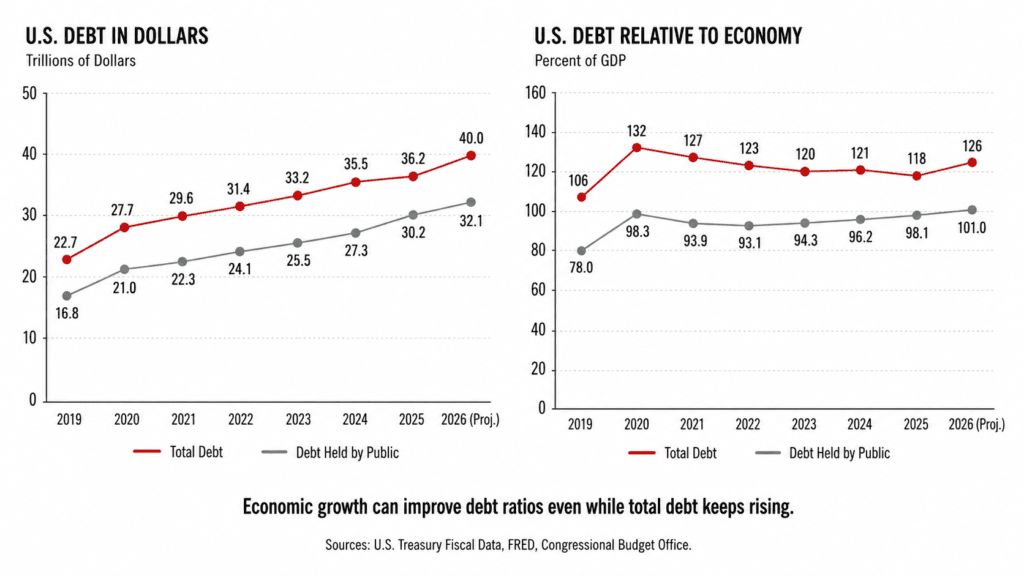
At the end of 2025, debt held by the public equaled about 99% of U.S. Gross Domestic Product (GDP). The Congressional Budget Office (CBO) projects it will reach approximately 101% in fiscal 2026 and 120% by 2036, exceeding the previous post-World War II record of 106%. [2][3]
That level alone does not tell the whole story. Federal debt spiked after the 2007 Financial Crisis and again during the Pandemic. It then continued rising even during periods when the debt-to-GDP ratio temporarily improved. The annual debt-to-GDP ratio rose to about 98.3% in 2020, fell to about 93.1% by 2022, and climbed back to about 98.1% in 2025. The dollar amount of debt held by the public, however, continued rising throughout that period. [4] That happened because the economy, the denominator in the debt-to-GDP ratio, was also growing rapidly.
This is important because economic growth is one of the healthiest ways to make debt more manageable. A larger economy produces more income, expands the tax base and increases the country’s capacity to support existing debt. Unsurprisingly, when you make more money, bills become easier to pay.
Growth can also make the debt picture look healthier than the government’s borrowing habits really are. If debt continues rising while GDP rises even faster, the debt-to-GDP ratio can improve even though the government has not reduced its debt or eliminated its deficits or many any adjustments for its financial condition. Inflation can amplify that effect by increasing nominal GDP while simultaneously reducing household purchasing power.
Growth can make debt easier to carry, but it should not be mistaken for progress in controlling the growth of debt.
That distinction has become increasingly important because large deficits have persisted even after the extraordinary pandemic period.
The CBO projects a $1.9 trillion federal deficit in fiscal 2026, equal to 5.8% of GDP, compared with an average deficit of 3.8% of GDP over the past 50 years. CBO describes sustained deficits of this size as historically unusual when unemployment is expected to remain below 5%. [2][3]
The concern, therefore, is not simply that federal debt is high. It is that the country is running unusually large deficits on top of an already historically large national debt.
For more detail on what is included in the various debt measures, see TPI’s National Debt Components Explained and The National Debt: Explained.
1. Your Cost of Living and the Purchasing Power of Your Money
One of the most broadly felt economic risks is inflation, the erosion of what each dollar can buy.
After decades in which inflation was generally far below the rates Americans experienced in the 1970s and early 1980s, the inflation surge during and after the pandemic reminded households how quickly rising prices can affect everyday life. Consumer prices rose 7.0% during 2021 and 6.5% during 2022. [7]
Federal debt does not automatically cause inflation. Prices can rise for many reasons, including energy costs, supply disruptions, wages, monetary policy and strong consumer demand.
However, persistent large deficits and growing debt can increase inflation risks under some circumstances. High debt can also create increasing tension between fiscal and monetary policy if the interest rates needed to control inflation substantially increase the government’s cost of servicing its debt. Research on advanced economies has found that greater fiscal-monetary tensions have historically been associated with higher debt, higher inflation and lower real returns on bonds and cash. [6]
Inflation can also reduce the real, inflation-adjusted value of debt that was previously issued in fixed dollars. In that sense, inflation can make yesterday’s debt easier for a government to carry as the value of the dollar depreciates.
However, it is not free.
The same inflation that reduces the real value of government debt also reduces the purchasing power of your wages, savings and retirement income. You experience that at the grocery store, in housing, utilities, insurance, healthcare and the everyday cost of living. Inflation can also make future government borrowing more expensive if investors demand higher interest rates to compensate for the loss of purchasing power.
This does not mean America is destined for high inflation or that policymakers intend to “inflate away” the debt, although they may. It means that as debt becomes larger, the relationship between fiscal policy, monetary policy and inflation becomes increasingly important. The CBO lists higher inflation expectations and declining confidence in the dollar among the possible adverse outcomes associated with high and rising debt. [2]
TPI explores this issue more deeply in Fiscal Dominance: Explainer.
2. The Interest Rate You Pay
The federal government competes for capital in the same financial system used by businesses, homebuyers and other borrowers.
Treasury securities also help establish the foundation from which many other interest rates are priced. That does not mean federal debt determines your mortgage rate. Mortgage rates are influenced by inflation, Federal Reserve policy, economic expectations, credit risk and other market forces. Greater federal borrowing can put upward pressure on interest rates. CBO warns that large and growing federal debt can increase borrowing costs throughout the economy, reduce private investment and slow economic growth. [2]
For an ordinary household, higher financing costs can mean a more expensive mortgage, fewer affordable homes, larger car payments and higher costs for businesses that eventually work their way through the economy. The same higher rates affecting households eventually affect Washington as well.
3. More of the Federal Budget Goes to Interest
Borrowing costs money.
The CBO projects federal net interest costs of roughly $1 trillion in fiscal 2026, rising to approximately $2.1 trillion annually by 2036. [2][3]
That matters because interest pays for borrowing that has already occurred. A dollar spent building infrastructure produces infrastructure. Defense spending purchases equipment, personnel and capabilities. Social Security provides income to beneficiaries. Interest largely pays for past borrowing. Net interest costs have already become one of the largest categories in the federal budget. The CBO projects that interest spending will exceed defense spending throughout the current decade. [5]
As interest expenses grow and absorb more of the federal budget, fewer dollars remain available for other priorities unless the government collects more taxes, cuts or slows other expenses, or borrows more and adds to the debt. These pressures mean policymakers have less room to choose.
TPI examines this growing constraint in The Budget Autopilot Challenge.
4. Debt Can Begin Feeding on Itself
This is one of the most pernicious, important and least intuitive parts of the debt problem.
The basic issue is that the federal government currently spends substantially more each year than it collects. The CBO projects about $7.4 trillion in federal spending against $5.6 trillion in revenue in fiscal 2026, producing a deficit of approximately $1.9 trillion. Roughly a third more spending than revenue collected [2]
That deficit requires additional borrowing.
The basic cycle is:
Structural Budget Shortfall → Deficit → More Borrowing → More Debt → More Interest
But interest is itself an expense in the federal budget, and a rapidly growing one.
If government continues running deficits while also borrowing to cover growing interest costs, a negative self-reinforcing cycle can develop:
More Debt → More Interest → Larger Deficits → More Borrowing → More Debt
Higher interest rates can accelerate that process by making debt more expensive and further reducing room for other budget priorities.
The government does not refinance the entire $40 trillion every time rates change. Treasury securities mature at different times and as older debt matures and new debt is issued, higher prevailing rates gradually work their way into the government’s average financing cost.
The CBO’s projections illustrate the effect: net interest rises from about $1 trillion in 2026 to $2.1 trillion in 2036, and CBO identifies rising interest costs as a major driver of future deficits. [2][3] This feedback loop is not inevitable or irreversible. Fiscal discipline, Lower deficit spending, stronger economic growth, higher revenues, slower spending growth and lower borrowing costs can all improve the equation.
However, when debt and interest costs rise together, the country’s margin for error shrinks and the choices become progressively harder. For a deeper explanation of why the relationship between economic growth and borrowing costs matters, see TPI’s R > G: The Silent Threat to American Stability.
5. Your Job, Wages and the Economy
Government borrowing can also compete with private investment.
Economists call this “crowding out.”
The plain-English version is simpler: capital that finances government borrowing cannot simultaneously finance every private investment opportunity.
When the federal government continually needs large amounts of capital to finance deficits, borrowing costs can rise and some private investments become less attractive.
- A business may delay building a factory.
- A developer may decide a housing project no longer works financially.
- A company may invest less in equipment, research or expansion.
The CBO concludes that greater federal borrowing can reduce private investment and ultimately reduce economic output relative to what it otherwise would have been. [2]
This means the economy, and eventually jobs, wages and incomes, can be smaller than they otherwise would have been.
This does not necessarily mean recession or falling wages. It means that over time, growth can be slower than it might otherwise have been. Over one year, the difference may be difficult to notice. Over decades, relatively small differences in economic growth compound. There is an unfortunate feedback here as well: slower economic growth makes the debt harder to manage, even though stronger growth is one of the least painful ways to improve the debt picture.
6. Taxes, Benefits and Government Services Face Harder Choices
A government can run deficits for a long time.
However, it cannot indefinitely have spending, debt and interest costs grow faster than the economy and a revenue base supporting them without eventually facing increasingly difficult choices.
Policymakers have only a handful of broad ways to approach the challenge:
- Raise revenue (taxes)
- Slow or reduce spending
- Increase economic growth
- Continue borrowing, adding to the debt and postponing the adjustment
- Use some combination of those approaches
Inflation has also historically reduced the real burden of nominal debt, but at the cost of purchasing power and potentially higher future interest rates. [6]
There are countless policy choices within those categories, and reasonable people can disagree strongly about which are appropriate.
The arithmetic itself is less negotiable.
As interest consumes more revenue, preserving existing benefits and services while keeping taxes unchanged becomes increasingly difficult to impossible, particularly as CBO projects spending on Social Security, Medicare and interest to grow faster than economic output over the coming decade. [3]
TPI examines the major policy paths and their tradeoffs in Ways Out of Debt: U.S. Options for National Debt and Beautiful Deleveraging: Reducing Debt Without Pain?.
7. Less Room for the Next Emergency
There is one more consequence that is easy to overlook.
Borrowing capacity is itself a national asset.
America has repeatedly borrowed enormous amounts when circumstances required it, for wars, recessions, financial crises and the COVID-19 pandemic. America’s financial system, creditworthiness and economic resources give the federal government the ability to respond rapidly without immediately collecting enough additional taxes to cover every emergency expense.
The $40 trillion national debt does not mean the United States has lost that capability but entering the next emergency with more debt and substantially higher interest expenses can make the response more expensive and the choices afterward more difficult. The CBO specifically warns that high and rising debt can constrain lawmakers’ ability to use tax and spending policy to respond to unforeseen events, support economic activity or strengthen national defense. [2] Think of it less as America approaching a fixed credit card limit and more as losing some of its financial cushion before knowing what the next emergency will be. Access to that emergency cushion becomes more expensive and potentially more restrictive as the existing debt burden rises.
Does $40 Trillion Mean a Crisis Is Coming?
No one can responsibly make that prediction from the debt level alone.
There is no universally accepted number at which government debt suddenly changes from manageable to catastrophic. The United States has substantial economic resources, a large tax base, deep financial markets and the world’s most important government securities market but “there is no magic crisis number” should not be confused with “the trajectory does not matter” and as the debt grows so does the risk. CBO projects debt held by the public rising to 120% of GDP by 2036, while annual deficits grow from $1.9 trillion in 2026 to $3.1 trillion and remain unusually large relative to the economy. [2]
CBO Director Phillip Swagel states plainly:
“Our budget projections continue to indicate that the fiscal trajectory is not sustainable.” [3]
While there are some significant voices expressing concern, some even saying we are past the threshold of no return. [8][9] However, these are not predictions of imminent collapse in the United States but a more realistic concern over a gradual loss of flexibility: more income devoted to interest, greater sensitivity to inflation and interest rates, less private investment, harder tax and spending decisions, crowding out of budget items due to debt, and fewer attractive choices when the country confronts its next major challenge.
So, What Does $40 Trillion in debt actually Mean for You?
The federal government’s financial condition increasingly influences the economic environment in which we live. Here is how that translates into what it can mean for you:
For your cost of living, persistent fiscal imbalances can increase inflation risks, reduce purchasing power and make affordability more difficult.
For your borrowing, large government financing needs can contribute to higher interest rates, making mortgages, car loans, business financing and other credit more expensive.
For your job and income, persistent government borrowing can compete with productive private investment and reduce future economic growth, potentially resulting in fewer job opportunities and weaker wage growth than would otherwise occur.
For your taxes, benefits and public services, rising interest expense leaves future policymakers with fewer easy choices, including pressure to raise revenues, slow spending growth, modify benefits or borrow still more.
For your savings and retirement, inflation and changes in interest rates can affect both the purchasing power and market value of financial assets. At the same time, growing interest costs reduce the broader federal budget flexibility available to address challenges such as Social Security’s projected funding shortfall. [3]
For the country, carrying more debt into the next recession, war or emergency leaves less financial flexibility to respond, potentially making the next shock more expensive or difficult to manage. [2]
These outcomes are not givens, but they are among the possible consequences of high and persistently rising debt. In total, they make the affordability issues become harder, especially for those on the lower end of the economic spectrum. In short, higher debt can make life harder.
America remains a wealthy, productive country with considerable economic strengths and policy choices available to it. Strong economic growth can make the debt substantially easier to manage and remains one of the least painful ways to improve the country’s fiscal position. Growth alone, though, cannot indefinitely compensate for structural deficits approaching $2 trillion a year.
The concern is not necessarily that America is about to run out of options. It is that continuing down the same path can gradually leave the country with fewer good options.
That is what makes the $40 trillion milestone worth understanding.
Not because a round number should frighten us, but because understanding the consequences and the choices ahead are an important part of Government Financial Literacy and the health and vibrancy of America.
References
[1] U.S. Department of the Treasury, Bureau of the Fiscal Service. (n.d.). Debt to the Penny. Fiscal Data. Debt to the Penny
[2] Congressional Budget Office. (2026, February 11). The Budget and Economic Outlook: 2026 to 2036. CBO Budget and Economic Outlook
[3] Swagel, P. L. (2026, February 11). Director’s Statement on the Budget and Economic Outlook for 2026 to 2036. Congressional Budget Office. CBO Director’s Statement
[4] U.S. Office of Management and Budget & Federal Reserve Bank of St. Louis. (2026). Federal Debt Held by the Public as Percent of Gross Domestic Product [FYGFGDQ188S]. FRED, Federal Reserve Bank of St. Louis. FRED debt-to-GDP series
[5] Congressional Budget Office. (2025, January 17). The Budget and Economic Outlook: 2025 to 2035. CBO 2025-2035 Outlook
[6] Bolhuis, M. A., Koosakul, J., & Shenai, N. (2024). Fiscal R-Star: Fiscal-Monetary Tensions and Implications for Policy (IMF Working Paper No. 2024/174). International Monetary Fund. IMF Fiscal R-Star paper
[7] U.S. Bureau of Labor Statistics. (2022). Exploring price increases in 2021 and previous periods of inflation. Beyond the Numbers. BLS inflation analysis
[8] Bloomberg/Ray Dalio (2026). Bloomberg Talks June 2026 https://www.youtube.com/shorts/t-HSCRczSJc
[9] CNBC/Jamie Dimon (2026). CNBC https://www.youtube.com/shorts/aPyLWg1Yoaw