
AI Transition – Run your own scenarios*
This tool is for discussion purposes only to understand the impact, timing, financial, and job impacts of AI to help understand the changes. We hope this will be used responsibly to start discussions on how to address what could be one of the largest impact on society since the industrial revolution.
AI Transition Scenario Calculator
Basic AI modeling tool to estimate how AI could change jobs, federal revenue, and the scale of UBI/UHI-style support over time.
Inputs
Outputs
AI Transition Scenario Calculator: What It Is and How to Use It
The AI Transition Scenario Calculator is a simple planning tool. It helps you explore how widespread AI adoption could affect three big things over the next 10-20 years:
- Jobs (how many roles could be displaced)
- US federal revenue (how tax receipts might change if the workforce changes)
- Support programs (the potential scale of UBI and UHI-style support)
This is not a prediction engine. It is a way to test “what if” scenarios and understand the size of possible change under different assumptions.
What the tool is doing (in plain terms)
The calculator starts with a timeline (start year and end year). Then it creates an “adoption curve” for AI – meaning AI spreads slowly at first, faster in the middle years, and then levels off.
From there, it estimates:
- How much of the job market is exposed to automation
- How strongly that exposure turns into net job displacement
- How job changes might affect federal revenue
- How large UBI (cash support) and UHI (health coverage support) costs could be if tied to displaced jobs
The charts let you hover over each year to see values and percentages.
How to use it
Step 1: Set the timeline
Pick the years you want to model. A common choice is 20 years (example: 2026 to 2046).
Step 2: Track 1 – AI adoption speed
- Midpoint year: when AI is roughly “half adopted” in your scenario
- Adoption speed (1-100): how fast the curve ramps up
- 1-25 = Low, 26-70 = Moderate, 71-100 = Severe
- Max adoption level: how high adoption gets by the end of your timeline
Step 3: Track 2 – Job impact
- Share of jobs that could be automated: long-run exposure
- How strongly AI replaces jobs (1-100): whether automation mostly changes tasks (low) or removes whole roles faster than new ones appear (high)
Step 4: Track 3 – Government response (money)
- Federal revenue as % of GDP: starting point for receipts
- How much displacement hurts revenue (1-100): how sensitive receipts are to job loss
- Ability to capture AI-era revenue: how well new mechanisms replace lost revenue
- UBI and UHI amounts: annual support per displaced person (model assumption)
Step 5: Run and compare scenarios
Click Run, then hover the charts year-by-year. Use Save/Load in the browser for quick testing, or Export/Import JSON to share scenarios.
Disclaimers
- This tool provides illustrative scenarios, not forecasts.
- It uses simplified relationships and does not model all economic feedback loops (inflation, interest rates, trade, migration, wars, policy shifts, business cycles, etc.).
- “Job displacement” here is an estimate of net roles affected, not a direct measure of unemployment.
- Results should be used for planning conversations, sensitivity testing, and education – not for personal financial decisions or policy design without deeper analysis.
- The Tax Project Institute is not an official Government agency
- Estimates are for illustrative purposes and not for official use.
AI Transition Modeling Calculator
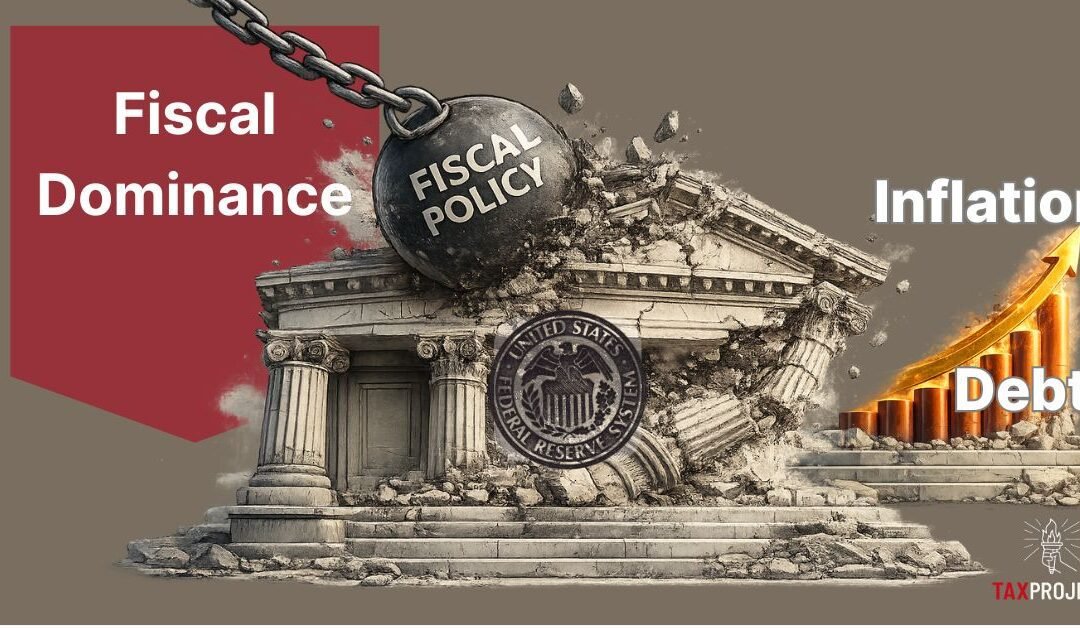
Fiscal Dominance Explained
In a healthy Economic environment the Central Bank of a country, the Federal Reserve (Fed) in the United States, manages the Monetary Policy that manages the money supply, and sets interest rates to keep inflation under control and the job market healthy. The Federal Reserve is said to have a dual mandate to maintain stable pricing (manage Inflation), and maximum employment (stable Jobs). While elected officials in the Executive Branch and Congress manage the Fiscal Policy that sets taxes and the budget that determines spending. These functions are setup as independent processes with different goals.
Fiscal Dominance is a term used when a Country’s Debt and Deficits get so large that Fiscal Policy begins to, either explicitly or implicitly, steer Monetary Policy. This can be a very troublesome situation to be in because it puts two competing responsibilities into conflict at times, and in general should be avoided where possible because of the risks involved. In high debt environments, interest payments on the debt can become very large and begin to crowd out other Government spending. As the interest rates raise, the debt payments grow and compound the challenges. This can put pressure on the Fed to go against their mandate to lower interest rates and thereby reduce the cost of the debt service payments. However, by lowering rates the Fed may lose control on Inflation which may rise higher than their target rate.
Former Treasury Secretary and Federal Reserve Chair Janet Yellen defines it as when deficits and debt put so much pressure on the government’s financing needs that Monetary Policy becomes “subordinate” to those needs, meaning the central bank is pushed to keep rates “lower than warranted” or buy government debt “to ease the government’s financing burden.” [1]
The challenge is that inflation becomes the easiest way out because it can immediately reduce the cost of debt service and quietly shrink the real value of what the Government owes. This is a lot easier for elected officials than raising taxes, cutting spending, or changing entitlement programs due to the unpopularity with constituents. However, through inflation it also shrinks the buying power of everyone’s dollars.

“If congress is unable or unwilling to address primary deficits the problems will compound and the temptation to rely on inflation or financial repression to reduce the debt burden will surely grow.”
Janet Yellen , “The Future of the Fed” January 4-5, 2026 [1]
Why does it Matter?
Since the COVID pandemic, after a long period of stable pricing, the US experienced higher than normal inflation, and most Americans now understand inflation, and what is being called the “Affordability Crisis” as something much more tangible and real. Inflation is no longer an abstract statistic. It is the slow (or sometimes fast) loss of what your money can buy. The Bureau of Labor Statistics tracks prices with the Consumer Price Index and explains inflation as when prices rise, the purchasing power of the dollar declines. [4]
The damage caused by inflation shows up everywhere: groceries, gas, rent, insurance, childcare, car repairs. If pay does not keep up with inflation then living standards slip. If you hold cash or earn a low interest rate on savings, inflation reduces the value of your money punishing savers, those on fixed income, and the most vulnerable.
You can also see inflation worry show up in markets. When people get uneasy about the future buying power of dollars, they often look for hedges. Gold is the classic example. Recently Gold has been hitting record highs above $5,000/oz in late January 2026, driven by safe-haven demand and uncertainty, along with expectations about interest rates and heavy Federal Reserve buying. [3]
None of this is to say Fiscal dominance is happening now, but as Janet Yellen recently said “the preconditions…are clearly strengthening.” (See Janet Yellen Statements here)

“the preconditions for fiscal dominance are clearly strengthening”
Janet Yellen, “The Future of the Fed” January 4-5, 2026 [1]
“I doubt Americans will wind up on the Fiscal Dominance course, but I definitely think the dangers are real and should be monitored.”
Janet Yellen , “The Future of the Fed” January 4-5, 2026 [1]
Why is this Dangerous?
The risks are not about political parties, or politicians, but basic math. Here are some of the challenges:
When Debt is High, Interest Increases Hurt!
When the government owes a lot, even modest levels of debt can become expensive with high interest rates. That expense to pay the rising interest cost on debt competes with everything else the government wants to do. For every 1% increase in interest rates debt service costs increase nearly $400 billion annually. [6] (See Table 1 below)
The Congressional Budget Office’s (CBO) February 2026 outlook (summarized by the Committee for a Responsible Federal Budget) shows debt held by the public around 100% of GDP (i.e. the entire US Economy) and projected to rise to about 120% by 2036. It also shows Net Interest costs (the amount we pay on debt) more than doubling from ~$970 billion in 2025 to about ~$2.1 trillion by 2036, rising from about 3.2% of GDP to about 4.6% of GDP. [2]
High Interest Costs Squeeze Budgets
Unlike many budget expenses, interest is the part you pay because of past spending. It does not build roads, improve schools, or provide services directly. As it grows, it can crowd out other priorities or force harder choices later.
The current Net Interest is larger than the expense of the US Military, so doubling that cost would be a very large expense putting pressure on other spending. Whether someone sees those numbers as “manageable” or “dangerous,” they are big enough to create strong political pressure around interest rates.
This is where Fiscal Dominance risk starts to become realistic: if interest costs feel like they are exploding, it becomes politically tempting to push for lower rates regardless of inflation conditions.
The Catch-22: Debt Service vs Inflation
For younger folks a Catch-22 is a situation with no good options. You’re dammed if you do, and dammed if you don’t.
Here is the doom loop in simple steps:
- Inflation is too high, or the risk of inflation is rising.
- The Fed raises rates to slow inflation and protect the value of the dollar.
- Higher rates raise the government’s interest bill over time.
- The higher interest rate increases debt service cost that squeezes the budget.
- Pressure rises to lower rates to “stop the bleeding” and lower interest costs.
- If rates are cut too soon, inflation can come back, and the cycle repeats.
Yellen’s warning is that when the central bank is constrained from raising rates because it would increase debt service or cause fiscal stress, inflation expectations can become “unanchored,” and people may start to think inflation is the “path of least resistance” for managing high debts. [1]
That phrase is worth translating: once a society starts to believe “they will inflate rather than make hard choices,” the value of money becomes a political variable. That is when inflation becomes harder to control.
| Interest rate | Estimated Net Interest | Delta vs Current |
|---|---|---|
| 1% | $0.39T | -$0.93T |
| 2% | $0.77T | -$0.54T |
| 3% | $1.16T | -$0.15T |
| Current (3.4%) | $1.31T | $0.00T |
| 4% | $1.55T | +$0.23T |
| 5% | $1.93T | +$0.62T |
| 10% | $3.86T | +$2.55T |
| 15% | $5.80T | +$4.48T |
| 20% | $7.73T | +$6.42T |
Can Both Sides be Right and Wrong?
It can be hard in our polarized environment not to think about this as either one side is Right or Wrong, however that misses the point. Both Fiscal and Monetary policy play important roles in the Economy and impact all Americans. Normally these can operate independently and support each other, a sort of Yin and Yang that balance each other out. The challenge when Debt and Spending get so large that they put Monetary and Fiscal responsibilities into conflict.
Fiscal Policy: Executive Branch and Congress
What they care about: Spending (Debt service) and Growth
Why they can be Right:
- Lower Interest costs can reduce Net Interest expenses that crowd out other spending and make the budget fragile.
- Lower rates can support growth that can expand the tax base and reduce immediate fiscal strain.
Why they can be Wrong:
- By leaning on the Fed to lower Interest rates they may increase inflation and reduce the value of the dollar.
Monetary Policy: The Federal Reserve
What the Fed cares about: Stable Pricing (Inflation) and Maximum Employment (Jobs)
Why the Fed is Right:
- Protecting purchasing power is not a luxury. When inflation is unstable, everyone lives with more uncertainty, borrowing costs and the Affordability crisis increase, and the value of the dollar diminishes.
- Yellen makes the key point that “stabilizing prices becomes significantly more costly” once inflation expectations take hold. [1]
Why the Fed can be Wrong:
- Tightening policy in a high-debt environment can create political backlash and institutional stress. Even if the Fed’s policy is “correct” on inflation, it can still trigger a fight over Fed independence that changes the rules of the game.
- Short term priorities due to massively rising Debt Service costs may pose greater danger than long term rising inflation.
This is the core Catch-22: the fiscal side is not crazy to care about interest costs, and the Fed is not crazy to prioritize inflation. Inflation can be a lot like a heart attack, it can go quietly unnoticed but suddenly impact you. By letting inflation slowly (or quickly) devalue the dollar, everything gets more expensive and your savings are worth less.
What does Fiscal Dominance look like?
Fiscal dominance usually does not arrive with a press release. It shows up as a drift in behavior and expectations, such as:
- Repeated pressure to cut rates mainly to reduce the government’s borrowing costs.
- A growing expectation that the central bank will not do what it takes to control inflation if it would make the budget painful.
- Challenges to the Federal Reserve autonomy
- Investors demand compensation to cover the additional Risk Premia because they worry the government will rely on inflation to manage the debt, devaluing the dollar.
Yellen’s Listed Preconditions
- Steep upward debt trajectory: CBO projects debt rising from ~100% of GDP in 2026 to over 150% in three decades—current levels already test sustainability.
- Persistent large deficits: ~6% of GDP overall (~3% primary), unprecedented outside wars/recessions, with no credible medium-term fiscal adjustment plan from either party.
- Debt service pressure on monetary policy: When debt hits ~120%+ GDP, rate hikes to fight inflation risk exploding interest costs, forcing Fed to prioritize debt financing over its dual mandate.
Yellen flags the same idea: fiscal dominance can raise borrowing costs if investors become concerned the government will rely on “inflation or financial repression” to manage debt. [1]
“Kick the can down the Road”
Many Western Democracies are trapped in a similar situation: High Debt, Growing Entitlements, Limited will to Raise Taxes or Cut Spending. It is politically far easier to postpone painful choices. Nobody wants higher taxes. Nobody wants spending cuts. Nobody wants entitlement changes. That political reality is not a moral failing; it is a constraint.
However, the longer we stay on our current fiscal path and our debt continues to grow, the more painful the eventual adjustment will be. This is not a problem that goes away on its own. Yellen states the hard version of this idea: if markets do not expect future budget surpluses to cover the debt, “the adjustment eventually comes via inflation or default.” [1]
For the U.S., “default” is not the scenario most people think about, although all three rating agencies have downgraded the US [5]. The more realistic concern is a mix of:
- Higher Inflation – everything will cost more, and your money will be worth less
- Higher Borrowing Costs – credit will cost more
- Forced Fiscal Changes – some combination of tax increases and/or spending cuts
This is why Fiscal Dominance is not just a “Fed independence” topic. It is about whether the country chooses a gradual planned path or dramatic unplanned (but predictable) one. (See our Article: Ways out of Debt)
Summary
Fiscal Dominance is not a slogan and it is not “here” yet. It is a risk that grows when debt is high, and interest costs are large, and political incentives push for easier money even when inflation is not truly under control. The stakes are high, we can begin to manage it now, or we risk higher inflation and the devaluation of the dollar and the cost of everything increasing.
Citation
[1] Janet Yellen, “Remarks on the future of the Fed: Central bank independence and fiscal dominance” (Brookings, Jan 2026). (Brookings)
[2] CBO February 2026 outlook summary (Committee for a Responsible Federal Budget, Feb 11, 2026). (CRFB)
[3] “Gold jumps over 3% to record peak…” (Reuters, Jan 27, 2026). (Reuters)
[4] BLS CPI FAQ and purchasing power notes (BLS). (Bureau of Labor Statistics)
[5] CNN. May 2025. “The United States just lost its last perfect credit rating.” (CNN)
[6] Based on US Treasury Debt to Penny 2/12/26, average rate on interest-bearing debt 12/4/25 Peterson Foundation
Fiscal Dominance: Explainer
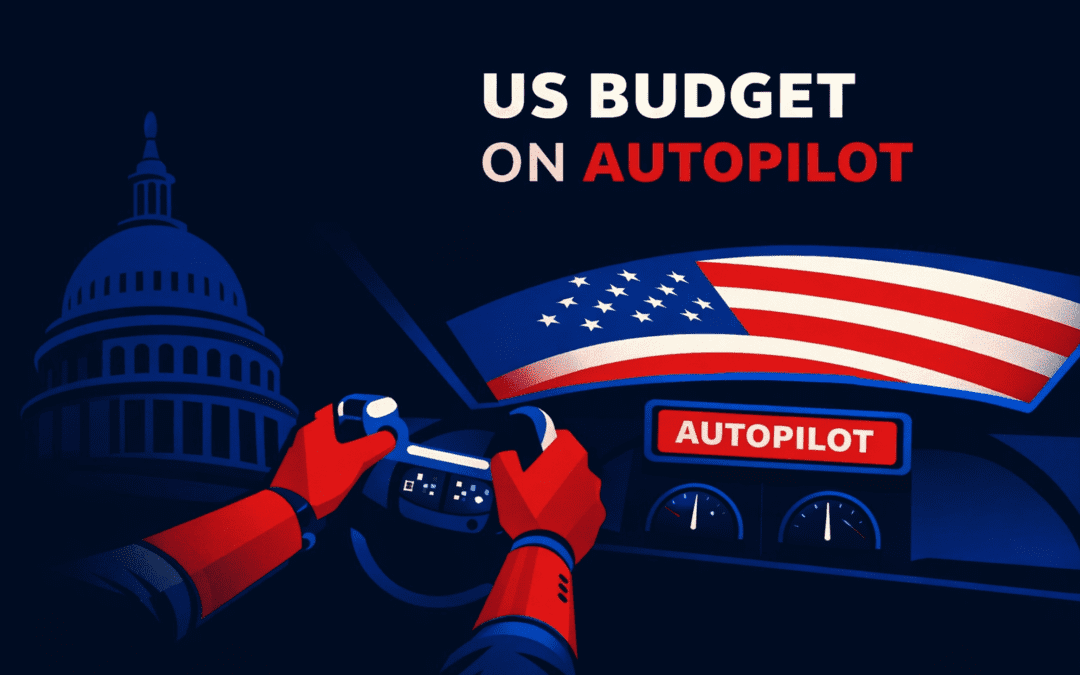
When Discretionary Becomes the Small Slice
The US Federal budget appears as something Congress actively “sets” each year. In reality, a growing share runs on autopilot – governed by laws passed in prior years and by interest costs tied to past borrowing. That shift matters because it reduces flexibility. When the adjustable slice gets smaller, even well-intentioned efforts to “balance the budget,” “cut waste,” or “fund new priorities” run into a hard constraint: there is less room to move without changing the underlying laws. [1][2]
Office of Management and Budget (OMB) historical data shows a long, clear trend: discretionary spending used to represent most Federal outlays (spending) as recently as the 1960s, and today it represents roughly a quarter. [2] Figure 1 illustrates the same core idea: over time, the “annual choice” (a.k.a. Discretionary) portion shrinks while Mandatory spending and Net Interest take up more and more of the total.
For plain-language definitions of discretionary, mandatory, and entitlements, see Tax Project Institute’s explainer. [1]
Figure 1. Discretionary vs Mandatory & Net Interest (share of total federal outlays).

As the Discretionary component of the budget continues to shrink as a percentage of the budget Congress is left with less flexibility, and fewer tools to combat Fiscal challenges. While this was done intentionally in many cases to ensure that funding for critical programs like Social Security, and Medicare are funded, it has the effect of hamstringing the legislative branch in a number of ways.
1) Smaller Steering Wheel
Discretionary spending is the part of the budget Congress decides through the annual appropriations process. It funds many of the visible functions people associate with government: agencies, staffing, operations, contracts, grants, and a wide range of public services. [3]
As discretionary becomes a smaller share of total outlays, the annual appropriations process controls less of the overall budget. Congress is still making choices, but with fewer degrees of freedom – all but roughly one quarter of the budget is on auto pilot before they even start. The practical result is simple: fewer options exist inside the discretionary part of the budget that can be changed quickly without changing the law.
This is the first flexibility problem. Many public debates treat the entire budget as negotiable every year. It is not. A rising share is effectively pre-committed by statute and by the interest payments on our National Debt. [2][3] Because of this there is less room to swing, move budget to areas that may require it without taking on additional debt, and larger budget deficits.
2) “Automatic” but not “Unchangeable”
Mandatory spending runs based on permanent law: eligibility rules, benefit formulas, payment rates, and automatic adjustments. It does not require an annual appropriations vote to continue. [3] These are essentially the auto pilot components of the Federal Budget.
However, Mandatory spending can be changed. The challenge is that it usually requires changing the underlying statute, which often involves complex policy design, distributional tradeoffs, and longer legislative timelines often met with gridlock in our current political environment. That makes it harder to adjust Mandatory programs as a “quick fix” when budget pressure arises.
This creates a mismatch between politics and mechanics: discretionary levels can be adjusted in annual funding bills, while major changes to large mandatory programs, that take up the majority of the budget, typically require separate authorizing legislation and sustained political agreement. [3] This has the practical effect of making most of the budget off limits each year unless there is consensus on changing components of the mandatory budget, which both parties are often hesitant to do.
3) Entitlements Growth
A major reason the autopilot share grows is that many Mandatory programs are built to scale and expand cost automatically. Spending can rise because:
- More people become eligible (demographics)
- Per-person costs rise (especially in health care)
- Benefit formulas and thresholds adjust over time (indexing, inflation)
- Refundable credits and income-tested benefits expand and contract with economic conditions [4]
This is not inherently “good” or “bad.” It is what happens when programs are designed to deliver stable benefits based on rules. But it does mean the budget baseline rises even if Congress takes no new action in a given year.
When that baseline grows faster than revenues, pressure concentrates on the smaller discretionary slice. The consequences show up in visible ways: funding fights, recurring rhetoric about “cuts,” and a sense that budgeting is constant crisis management. The underlying driver is often structural: the baseline is doing what the laws tell it to do. [2][4] The challenge is that the Entitlements component of the budget, in particular Health Care, has grown dramatically over the last few decades and is taking an increasingly larger piece of the budget.
4) Net Interest competes with everything else
Net interest is the cost of financing the US National Debt, in other words the interest paid on the National Debt in the form of Treasury securities (net of certain interest income). [3] It is not a program most people interact with directly, but it draws from the same pool of Federal Budget resources.
When debt levels are high and interest rates rise, interest costs can increase even if no benefit is expanded and no agency is funded more. That creates a second flexibility squeeze: interest is effectively a prior obligation. It gets paid first, and it reduces the dollars available for everything else. The US paid over $1 trillion in Interest on our National Debt, more than the entire US Military budget. [5]
This is one reason budget debates can feel increasingly zero-sum. When more of the budget is committed to mandatory programs and interest, the share left for annual choices becomes smaller, and tradeoffs become more challenging. [2][3]
5) Limited Efficiency Drives
Efforts to improve government efficiency, reduce overhead, and cut waste matter. But they run into arithmetic challenge, even if they eliminated the entire Discretionary budget, roughly three quarters of spending would still occur. While this isn’t practical, or likely, it provides perspective on the limitations of any cost cutting efforts, including the most recent DOGE efforts.
When discretionary spending is only roughly a quarter of federal outlays, it limits how large savings can be if reforms stay mostly inside discretionary programs. Even aggressive discretionary cuts face tradeoffs because discretionary spending includes many visible services and operational functions people rely on. [2][3] The discretionary budget includes many things that would probably surprise many citizens that they are discretionary including Education, the Military, Homeland Security, housing assistance, and medical programs like the CDC, and NIH to name just a few.
Meanwhile, the biggest structural drivers of the budget’s composition shift sit mostly in Mandatory programs and Net interest – areas that do not respond to short-term “efficiency” campaigns in the same way. [2][3]
That is why many high-profile cost-cutting efforts generate headlines but produce smaller results than promised: the biggest budget pressures are often located in the portions that require statutory change or longer-term fiscal adjustments.
What this means for citizens watching budget debates
The practical takeaway is straightforward: the annual budget fight is real, but it is increasingly a fight over a smaller share of total federal spending that limits Congressional flexibility. Big claims about “fixing the budget” without addressing larger Mandatory programs and Net Interest costs should be treated with skepticism – not because reform is impossible, but because the control levers are different. [2][3]
A budget with less discretionary share has less flexibility. That makes it harder to:
- Respond quickly to new priorities without borrowing and increasing deficits adding to the National Debt
- Reduce deficits through easy cuts
- Avoid political brinkmanship in appropriations
- Hold decision-makers accountable for the full budget (because only part is voted on annually) [2][3]
The budget autopilot challenge is fundamentally a governance challenge: when most spending is determined outside the annual appropriations cycle, meaningful change requires changing the rules – not just negotiating the yearly slice. [3] The growth of Entitlements and Mandatory spending and Interest are putting more an more pressure on the Fiscal Budget each year, leading to annual structural deficits in budget over $1 trillion a year. In FY 2025 the US Federal Budget was $7 trillion on revenue of $5.2 trillion with a $1.8 trillion deficit added to the $38 trillion National Debt. [6] The long term trend is clear, growing Mandatory spending will continue to consume more and more of the budget and lead to increasingly structural deficits which will compound the challenge as interest payments and entitlements continue to grow. Meaningful change will likely require adjustments to Mandatory programs and reduction in annual deficits through spending cuts and/or tax increases. See our article on Ways out of Debt HERE.
References
[1] Tax Project Institute. (2025, September 24). Mandatory vs discretionary vs entitlements: A simple explainer. https://taxproject.org/mandatory-vs-discretionary-vs-entitlements-a-simple-explainer/
[2] Office of Management and Budget. (n.d.). Historical tables. The White House. https://www.whitehouse.gov/omb/information-resources/budget/historical-tables/
[3] Congressional Budget Office. (2021, December 2). Common budgetary terms explained. https://www.cbo.gov/publication/57660
[4] U.S. Department of the Treasury, Fiscal Data. (n.d.). Federal spending (America’s Finance Guide). https://fiscaldata.treasury.gov/americas-finance-guide/federal-spending/
[5] Fortune. (2025, December 17). The $38 trillion national debt is to blame for over $1 trillion in annual interest payments. https://fortune.com/2025/12/17/38-trillion-national-debt-interest-payments-over-1-trillion-per-year-crfb-outlook-forecast/
[6] OMB. (2026). OMB Budget. https://www.whitehouse.gov/omb/information-resources/budget/
The Budget Autopilot Challenge
See how well you understand the Finances of America. Every American should understand the basic components of how our Government manages the finances of the Country. Only through knowledge are we able to understand the financial state of the country, and thus the health of the country and from this knowledge the ability to make informed decisions.
“Knowledge will forever govern ignorance; and a people who mean to be their own governors must arm themselves with the power which knowledge gives.”
James Madison
Test Government Finance Knowledge
Find out more about Government Financial Literacy here.
Government Financial Literacy
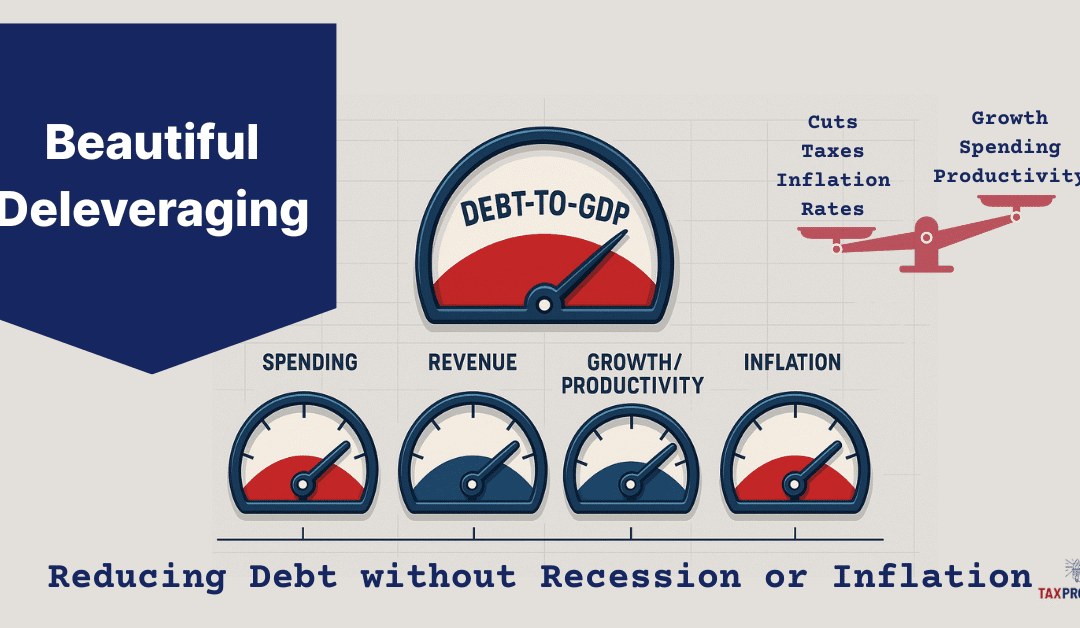
How the U.S. Could Reduce Debt Without Breaking the Economy
The U.S. National Debt just passed $38 trillion according to the US Treasury’s Debt to the Penny. [1][2] Not all debt is bad, but if it gets too large then debt can matter a lot, even those denominated in a fiat currency, because interest costs compound and grow they can crowd out other national priorities. Growing up your parents may have told you that it’s a lot easier to get into something, then to get out. That is especially true for debt, easy to get in, and painful to get out. Now that we have reached the point where interest payments are over $1 trillion annually, the US has crossed into that uncomfortable territory. The real challenge is to bring debt growth under control without causing a recession or a bout of high inflation. Ray Dalio, a billionaire hedge fund manager who has written books on Why Nations Succeed and Fail, and How Countries go Broke, popularized the idea of a “Beautiful Deleveraging” – a balanced, multi-year process that reduces the painful process of deleveraging when lowering debt burdens through a mix of growth, moderate inflation, controlled austerity, and targeted debt adjustments, rather than a painful deleveraging that could lead to recession, extreme reductions in services, tax increases, and austerity measures. [3][4]
This piece frames what a Beautiful Deleveraging could look like for the United States, why it’s hard, the challenges faced, and how policy could balance the Deflationary forces of tightening with the Inflationary tools sometimes used to ease the adjustment—aiming for a soft landing that improves the country’s long-run fiscal and economic health, while minimizing the pain along the way.
Current Status
- National Debt: The National Debt stands at just over $38 trillion (gross) with over $30 trillion of which is Debt held by the public. [2]
- Deficits: Structural Annual deficits running over $1trillion at around ~6% of GDP. [5][6]
- Interest Costs: Net Interest over $1 trillion annually. The Congressional Budget Office (CBO) Long-Term Budget Outlook (March 2025), Net Interest reaches 5.4% of GDP by 2055, up from ~3.2% of GDP around 2025. [7][8] Independent analysis by the Committee for a Responsible Federal Budget (CRFB) highlights a related pressure point: by the 2050s, net interest would consume roughly 28% of federal revenues, absent policy changes. [9]
According to CBO’s latest long-term outlook, by 2055 total Federal outlays (spending) are projected at about 26.6% of GDP, with Net Interest (interest paid on National Debt) near 5.4% of GDP. That means that roughly one-fifth (~20%) of Federal spending will be used to pay interest on the debt. At that scale, interest costs rival or exceed most standalone programs and risk crowding out other priorities if unaddressed. [7][8][9]
What “Beautiful Deleveraging” Means
In Economic terms, Beauty is about reducing debt while avoiding (or at least minimizing) the painful parts of deleveraging and therefore managing that successfully can be Beautiful. Dalio’s Deleveraging framework was originally developed to explain past debt cycles and emphasizes a balanced mix of tools so that the economy can reduce debt without crashing demand and involves these components:
- Spending Restraint (public and private demand constraint),
- Income growth (real GDP growth),
- Debt Restructuring or Terming out (Monetary intervention when necessary), and
- A measured amount of Money/Credit creation (Moderating and managing inflation).
These components, when executed with great skill, political courage, and balance, can help the economy grow enough to ease debt ratios while avoiding a deflationary spiral. [3][4]
For a sovereign like the U.S., that balance translates into a policy with credible fiscal consolidation, productivity-oriented growth policies, and a monetary policy that avoids both runaway inflation and hard-landing deflation. Because the U.S. issues debt in its own currency with deep capital markets, it has more room to maneuver than most, but it is not immune to arithmetic: if interest rates (R) run above growth (G) (See our Article on R > G), debt ratios tend to rise unless deficits are reduced. CBO’s long-term projections foresee precisely this pressure in their future outlook. [9]
Pain Points: Why Deleveraging Is Hard
There is a reason it’s hard, in general large broad spending cuts, and more and higher taxes are not popular. While the components and levers are well known, it takes a healthy amount of political courage to propose policies that maybe unpopular, a great deal of skill and coordination to execute these policies, and likely a good amount of luck and good timing for a sustained period likely across several administrations. A deleveraging can proceed along two of these painful paths, spending cuts and tax increases, and each has tangible real-world consequences:
- Spending cuts: Less public consumption and investment, fewer or slower growth in transfers, and potentially fewer (e.g. program eliminatinos) or lower service levels (e.g., processing times, enforcement, infrastructure maintenance). In macro terms, cuts are deflationary, they reduce aggregate demand, which can cool inflation but also growth and employment in the short run.
- Tax increases: Higher effective tax rates reduce disposable income and/or after-tax returns to investment, is also deflationary. Design matters: broadening the base (fewer exemptions) generally distorts behavior less than steep marginal rate hikes, but either path tightens demand.
Because both mechanisms have a contractionary/deflationary impact and create conditions that can lead to recession, economic hardship, and job loss, a multi-year consolidation approach is part of Dalio’s framework. Instead of a fiscal cliff and extreme austerity based spending cuts; Dalio’s approach phases changes over time; and pairs tighter budgets with growth-friendly policies (innovation, expansion, permitting, skills, productivity increases) that lift the supply side. The goal is to keep nominal GDP growth (real growth + inflation) from collapsing, otherwise debt-to-GDP can rise even while you cut, because the revenue denominator shrinks.
Deleveraging Menu (and Their Trade-offs)
The Tax Project has outlined (See our Article: “Ways Out of Debt”) a non-exhaustive review of policy options to deleverage. Below we provide a summary group them by mechanism. [10]
1) Consolidation via Revenues (Tax Increases)
Summary: Revenue measures (Tax Increases) are deflationary near-term but can be structured to minimize growth drag (e.g., emphasize consumption/external taxes with offsets, or reduce narrow, low-value tax expenditures).
2) Consolidation via Outlays (Spending Cuts)
Summary: Spending cuts can be deflationary; pairing it with supply-side reforms (education/skills, streamlined permitting for productive investment, R&D incentives, labor force productivity growth) can mitigate growth losses and raise potential output over time.
3) Pro-Growth, Supply-Side Reforms (Growth)
Summary: Growth and Supply side reforms (e.g. Productivity, Innovation, Permitting, Energy inputs) that generate real productive growth is the least painful way to lower debt-to-GDP without relying on high inflation.
4) Inflation and Financial Repression (Print Money)
Summary: Modest inflation can ease real debt burdens, part of Dalio’s balance, while managing highly destructive excess inflation. That is why the “beautiful” approach uses only modest inflation alongside real growth, fiscal and monetary management, not inflation as the main lever. [7][9]
The Sooner we Start, the Easier it is
The bottom line is, the longer we wait the harder it gets, the problem will not go away on its own, it only gets worse over time. The 2025 CBO long-term outlook provides a forecast, and it doesn’t paint a great picture:
- Debt Outlook: Debt held by the public rises toward 156% of GDP by 2055, under current-law assumptions. [8][11]
- Outlays vs Revenues: Outlays (spending) climbs from ~23.7% of GDP (2024) to 26.6% (2055); revenues rise more slowly to 19.3% – expanding an already large and persistent structural gap. [8][12]
- Net interest: Reaches 5.4% of GDP by 2055—roughly one-fifth of total federal outlays and around 28% of Federal revenues. [7][8][9]
Those numbers underscore the reason to start now: the later the adjustment, the harder the challenge required to stabilize debt. Conversely, a timely package that the public views as credible and fair can anchor long-term rates lower than otherwise, reducing the interest burden mechanically.
A “Beautiful” U.S. Deleveraging
The Tax Project does not propose or advocate specific policies, however a workable plan using the Dalio Framework would likely include a mix of the following components aimed to stabilize debt-to-GDP within a decade and then bend it downward while sustaining growth and guarding against excessive inflation relapse. A balanced approach:
- A multi-year fiscal framework enacted up front allowing for a ordered and measured deleveraging.
- Credible guardrails: Deficit targets linked to the cycle; a primary-balance path that improves gradually, with automatic triggers to correct slippage.
- Composition: Roughly balanced between base-broadening revenues and spending growth moderation in the largest programs (phased in).
- Quality: Protect high-return public investment; target lower-value spending and tax expenditures first.
- Administration: Resource the revenue authority to improve compliance; align incentives and simplify.
- A growth package to offset the deflationary impulse.
- Supply-side reforms with high ROI: energy and infrastructure permitting; skilled immigration; workforce skills; competition policy that fosters innovation and productivity tools.
- Private-sector: Reduce regulatory frictions that impede capex expenditures in goods and critical infrastructure.
- Monetary-Fiscal Coordination in the background—not Fiscal Dominance.
- Monetary-Fiscal Coordination: The Federal Reserve keeps inflation expectations anchored; it does not finance deficits but it can smooth the adjustment by responding to the real economy and anchoring medium-term inflation near target. Over time, a credible Fiscal policy promoting growth helps bring Rates (R) down toward Growth (G), easing the arithmetic. [7][9]
- Contingency tools (use sparingly)
- “Terming out” Treasury debt Lock in more fixed, long-term loans and rely a bit less on short-term IOUs. Why it helps: If rates rise, less of the debt has to be refinanced right away, so interest costs don’t spike as fast. If the term premium is reasonable and the Fed is in an accommodative stance, shorter term lower rate treasuries maybe attractive to reduce Net Interest expenses.
- Targeted restructuring (not the federal debt—specific borrower groups) Adjust terms for groups where relief prevents bigger damage (e.g., income-based student loan payments, disaster-area mortgage deferrals). Why it helps: Stops small problems from snowballing into defaults and job losses while the government tightens its own budget.
This mix qualifies as “beautiful” by balanacing inflationary and deflationary elements. It shares the burden across levers; it avoids hard financial shocks; it relies primarily on real growth + structural balance rather than high inflation or sudden austerity. Done credibly, long-term rates fall relative to a laissez-faire (do nothing) approach, lowering interest costs directly and via lower risk premia. The country benefits both intermediate (by not inducing a recession and harsh economic measures), and long term freeing up revenue to more productive uses than Debt payments, and supporting growth.
Managing the Macro Balance: Deflation vs Inflation
All this sounds good, but the practical art is to offset deflationary consolidation with pro-growth supply measures, not with high inflation. Consider the balancing act between these different variables:
- Consolidation (deflationary): Fiscal discipline reduces demand, manages structural gaps, good for taming inflation; risky for growth if overdone or badly timed.
- Growth Reforms (disinflationary over time): Expand supply, lower structural inflation pressure; raise real GDP and productivity, improving the debt to GDP ratio.
- Monetary Stance: Should keep inflation expectations managed; if growth softens too much, gradual monetary easing is available if inflation is on target.
- Inflation temptation: Modest inflation can reduce some of the burden mechanically, but leaning on inflation as the adjustment tool can backfire if markets demand higher interest rate (term) premiums; nominal rates can rise more than inflation, worsening R > G and Net interest. CBO’s baseline already shows interest outlays rising markedly even without an inflationary strategy. [7][9]
A “Beautiful Deleveraging“ aims too creates a “soft landing” keeping nominal GDP growth positive, inflation expectations managed, and real growth strong enough that debt-to-GDP falls without creating undue Economic hardships. Managing each of these variables with the often blunt tools available, many of which don’t manifest for months, or years is quite the magic trick, requiring patience, skill, and acumen.
Risks and Pitfalls
The road ahead can be bumpy and full of challenges, managing the risks is key to a successful deleveraging. Here are some areas that can derail a “Beautiful Deleveraging.”
- Front-loaded austerity that slams demand into a downturn or recession; a gradual path anchored by rules and automatic stabilizers is safer and creates less hardships. It means that we will endure less pain over a longer period. Some may want to rip the band aid off and take the measures all at once.
- Policy whiplash (frequent reversals) that destroys credibility and raises risk premia (higher Interest rates); stable consistent policies beat one-off “grand bargains” and political vacillations.
- Over-reliance on rosy outlooks; plans should make conservative growth assumptions, and reasonable baselines.
- “Kicking the can” down the road with laissez-faire policies until interest dominates the budget, leaving painful, crisis-style adjustments as the only option is the biggest of all the Risks. CBO’s outlooks illustrates how waiting raises the eventual cost, and negative consequences. [7][8][9]
Is it Worth it?
On the surface, that’s an easy question, however the answer may pit generations against each other each with their own point of view and different perspectives. Current generations at or near retirement who may not see the worst effects of a laissez-faire policy may see the risk of recession, and cut backs in service as an unacceptable change to their Social Contract which they may have worked a lifetime under a set of expectations that they counted on. Younger generations, may see it as generational theft, placing an undue burden on them for debt they had little or no part in creating. Both are valid perspectives, however, the long term effects of a “Beautiful Deleveraging” will deliver these positive durable payoffs for the Country:
- Out of Doom Loop: High debt is a trap, as out of control interest expenses rise, debt grows and the gap between revenue and debt rises in a self reinforcing doom loop. Breaking that loop is key to a healthy economy.
- Lower Interest burden: As debt drops, so does Net Interest expenses. Instead of crowding out other expenses, revenue is freed up to other National Priorities (e.g. Healthcare, Education, Infrastructure, Social Services, Surplus, Sovereign Wealth). [7][9]
- Greater Macro resilience: With manageable debt exogenic shocks, pandemics, wars, financial events, give the Government financial space to manage these events without taking on negative levels of debt.
- Higher Trend growth: When consolidation is paired with genuine productivity reforms, lower debt ratios are correlated with higher growth, supporting living standards and the tax base. [14][15][16]
Summary
A “Beautiful Deleveraging” is but one way to approach the intractable problem of high debt. It represents a reasonable approach that balances near term realities with long term impacts. Our choices now will define the America of the future, and the quality of life younger Americans will have and future generations will inherit. Will it be painless? Probably not, it will likely require some sacrifice and discipline. The challenge wasn’t created in a short period, and it won’t be solved in a short period. Is it achievable? If we face the truth with candor about trade-offs, accept phased steps that the public deems fair, and have a bias toward investments that raise long-term productive capacity, than it is possible. The biggest question is the will of the American people. That, more than any single policy, will determine our future. At the Tax Project we will always bet on informed Citizens making the best choices for America – we will always bet on America. That defines the essence of a “Beautiful Deleveraging.” [3][4][10]
Citations
[1] U.S. Department of the Treasury, America’s Finance Guide: National Debt (accessed Oct. 2025): “The federal government currently has $37.98 trillion in federal debt.” (fiscaldata.treasury.gov)
[2] Joint Economic Committee (JEC) Debt Dashboard (as of Oct. 3, 2025): Gross debt ~$37.85T; public ~$30.28T; intragovernmental ~$7.57T. (jec.senate.gov)
[3] Ray Dalio, What Is a “Beautiful Deleveraging?” (video explainer). (youtube.com)
[4] Ray Dalio, short-form clip on “beautiful deleveraging.” (youtube.com)
[5] Reuters coverage of CBO near-term deficit path (FY2024-2025). (reuters.com)
[6] Associated Press summary of CBO’s 10-year outlook (debt +$23.9T over decade; drivers). (apnews.com)
[7] Congressional Budget Office, The Long-Term Budget Outlook: 2025 to 2055—headline results: net interest 5.4% of GDP by 2055; outlays path. (cbo.gov)
[8] Peter G. Peterson Foundation, summary of the 2025 Long-Term Outlook: outlays to 26.6% of GDP; interest path and historical context. (pgpf.org)
[9] Committee for a Responsible Federal Budget (CRFB), analysis of CBO 2025 outlook: interest consumes ~28% of revenues by 2055; R > G later in the horizon. (crfb.org)
[10] Tax Project Institute, Ways Out of Debt: US Options for National Debt (June 14, 2025). (taxproject.org)
[11] Reuters recap of CBO long-term debt ratio (public debt ~156% of GDP by 2055). (reuters.com)
[12] CBO, Budget and Economic Outlook: 2025 to 2035 (context for near-term path). (cbo.gov)
[13] Ray Dalio, What is a Beautiful Deleveraging? https://youtu.be/wI0bUuQJN3s
[14] Kumar, M. S., & Woo, J. (2010). Public Debt and Growth (IMF Working Paper WP/10/174). International Monetary Fund. https://doi.org/10.5089/9781455201853.001
[15] Cecchetti, S. G., Mohanty, M. S., & Zampolli, F. (2011). The Real Effects of Debt (BIS Working Paper No. 352). Bank for International Settlements.
[16] Eberhardt, M., & Presbitero, A. F. (2015). Public debt and growth: Heterogeneity and non-linearity. Journal of International Economics, 97(1), 45-58.
Beautiful Deleveraging: Reducing debt without pain?
We are a non-profit
Tax Project Institute is a fiscally sponsored project of MarinLink, a California non-profit corporation exempt from federal tax under section 501(c)(3) of the Internal Revenue Service #20-0879422.