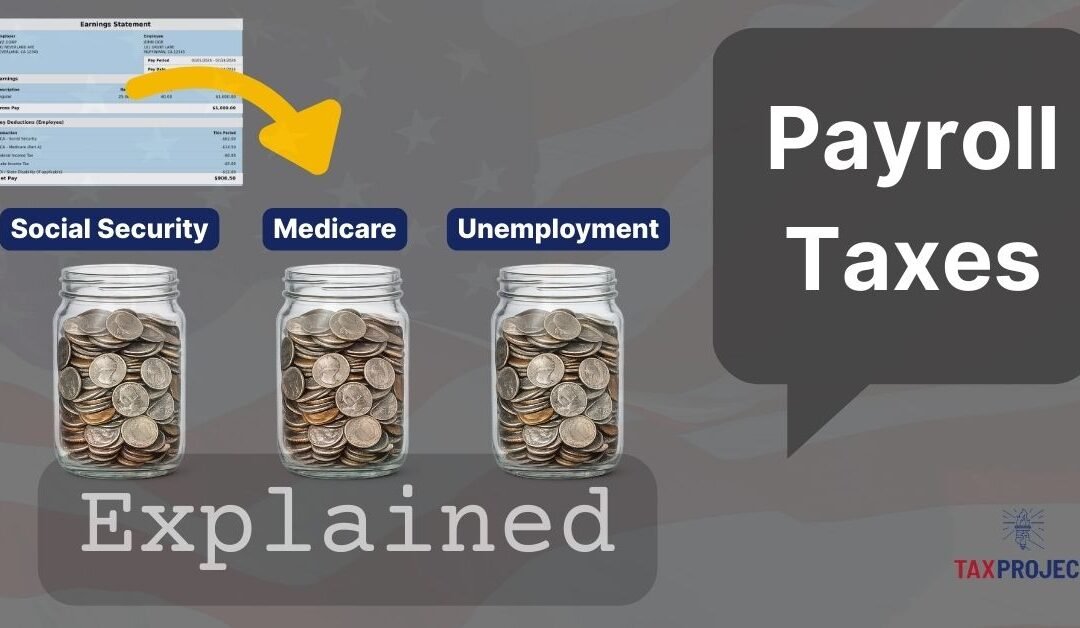
Payroll taxes are taxes tied directly to wages and salaries. They are collected automatically through payroll withholding and employer payments, and they are the primary way the U.S. finances Social Security and part of Medicare, along with federal and state unemployment systems. In practice, payroll taxes are among the most “unavoidable” taxes for working households because they apply to paychecks from the first dollar of covered wages, regardless of whether you ultimately owe federal income tax.
This explainer covers (1) the purpose of payroll taxes, (2) payroll taxes vs other paystub withholdings, (3) the Federal, State, and Local components and how they’re calculated, (4) the employer share and why it matters, (5) a short history of how payroll taxes started, (6) where payroll taxes fit in the revenue picture, (7) and why payroll taxes are often regressive.
Payroll Tax History
The Modern U.S. Payroll Taxes grew out of the Great Depression era. They were part of the Franklin D. Roosevelt’s New Deal program introducing sweeping new social programs as part of America’s social safety net. The Social Security program was designed to support income in Old Age (Retirement), and a separate Federal Unemployment insurance framework. The Social Security Act was signed into law on August 14, 1935, and has continued to be updated ever since. In 1939 Survivor benefits were added, Disability benefits were part of the Social Security Amendments of 1956 after a disability freeze was created in 1954. Payroll taxes began to be collected in 1937, and monthly benefits began in 1940. [7]
Why Payroll Taxes were designed this way: policymakers wanted a long term structural financing mechanism tied to work, with contributions from both Workers and Employers. That approach created a dedicated funding stream and helped define the program as earned social insurance.
Unemployment insurance also developed as a Federal-State system financed largely through Employer payroll taxes, with Federal FUTA operating as a Federal layer and States running their own benefit systems and tax structures. [5] [6]
Purpose of Payroll Taxes
Payroll taxes exist to fund specific “social insurance” programs tied to work. The idea is that when you earn wages, you and your employer contribute to programs that provide benefits during retirement (and for survivors and disability) and provide income support during periods of unemployment. That design matters because it explains why payroll taxes are structured as a percentage of wages, why they show up separately from income taxes, and why some parts have cap limits or thresholds.
Social Security, for example, is financed primarily through payroll contributions. It was designed as contributory insurance tied to earnings and work history, rather than being funded solely through general income taxes. That “contributions for benefits” framing is baked into how the taxes are calculated and how the programs are discussed in policy debates. [1]
Payroll Taxes vs “Everything Withheld”
A paystub can look like a pile of taxes and deductions, but it helps to separate them into three categories:
Payroll taxes (the focus of this article): wage-based taxes that fund Social Security, Medicare, and unemployment programs. [2]
Income tax withholding: Federal income tax (and sometimes State/Local income tax) withheld from paychecks as a prepayment of your income tax liability. These are not “payroll” taxes even though they’re withheld by payroll.
Deductions: health insurance premiums, retirement contributions, HSA/FSA contributions, and other benefit deductions. These aren’t taxes, though they can affect “taxable wages” for certain taxes depending on the type of benefit.
The Internal Revenue Service (IRS) often uses the broader term employment taxes to describe the full set of tax responsibilities connected to wages (withholding, depositing, and reporting). IRS Publication 15 is a primary reference employers use for these rules. [3]
“Covered wages” means wages that are subject to a specific payroll tax (for example, wages subject to FICA, FUTA, or state unemployment tax rules).
Payroll Tax Components
When you look at your pay stub you will likely see a whole bunch of acronyms and line items. These come from both the Federal Government and State/Local Governments. They use a lot of acronyms and some of them are shorthand for more than one component. Here are the components you will see in some form or another on your stubs.
Federal Payroll Taxes (core components)
FICA (Federal Insurance Contributions Act):
The Federal Payroll Taxes for Social Security and Medicare that are withheld from wages (and matched by employers). Items 1–3 below are FICA taxes: Social Security and Medicare, including the Additional Medicare Tax that applies to higher earnings. [3]
1) Social Security Tax – Old-Age, Survivors, and Disability Insurance (OASDI)
Rate: 6.2% withheld from employees and 6.2% paid by employers. [1]
Wage base (cap): Social Security tax applies only up to a maximum amount of wages each year. For earnings in 2026, the Social Security wage base is $184,500. [1]
What you see: When your year-to-date wages cross the wage base, Social Security withholding stops for the rest of that calendar year. [2]
Simple formula (employee side): Social Security tax = 6.2% × wages up to wage base [1]
2) Medicare Tax (Part A / Hospital Insurance)
Rate: 1.45% withheld from employees and 1.45% paid by employers. [2]
No wage cap: Medicare tax applies to all covered wages, unlike Social Security. [2]
Rate: An additional 0.9% on Medicare wages above certain thresholds which vary by filing status (see Table 1). [4]
Employer withholding rule: Employers must begin withholding the additional 0.9% once an employee’s wages paid by that employer exceed $200,000 in a calendar year, regardless of filing status. [4]
Simple formula (conceptual): Additional Medicare Tax = 0.9% × wages above the applicable threshold [4]
Filing Status
Threshold
Single
$200K
Married filing jointly
$250K
Married filing separately
$125K
Table 1
4) Federal Unemployment Tax (FUTA)
Who pays: Employer-paid (not withheld from employees). [5]
Basic structure: The standard FUTA tax rate is 6.0% on the first $7,000 of wages per employee per year. [5]
Credits: Employers typically receive credits for state unemployment taxes paid, often reducing the effective FUTA rate substantially (with exceptions in “credit reduction” situations). [5]
State Payroll Taxes (core components)
5) State Disability Insurance (SDI)
Who pays: Varies by state; commonly employee-paid via paycheck withholding (and in some states employer-paid or split). [6]
Basic structure: A state-run insurance program funded through payroll contributions in some states that provides partial wage replacement when a worker can’t work due to a non-work-related illness or injury (and, in some states, certain pregnancy-related conditions). [6]
What you see: Often appears as “SDI” (or similar) on a paystub in states that run a disability insurance program. [6]
Simple formula (conceptual): SDI contribution = SDI rate × taxable wages (subject to state rules and any wage base). [6]
6) Paid Family Leave (PFL)
Who pays: Varies by state; commonly employee-paid via paycheck withholding (and in some states employer-paid or split). [6]
Basic structure: A state-run program funded through payroll contributions in some states that provides partial wage replacement when a worker takes qualifying family or caregiving leave (for example, bonding with a new child or caring for a seriously ill family member). [6]
What you see: Often appears as “PFL” (or a related label) on a paystub in states that offer paid family leave funded through payroll contributions. [6]
Simple formula (conceptual): PFL contribution = PFL rate × taxable wages (subject to state rules and any wage base). [6]
7) State Unemployment Insurance / Unemployment Insurance (SUI/UI)
All states run unemployment insurance systems, but state payroll taxes vary widely. The biggest state Payroll tax category is State Unemployment Insurance (SUI/UI). In most cases:
Who pays: It is primarily employer-paid
Rate: The rate varies by employer
Wage base (cap): The taxable wage base varies by state, and Employers may also face additional state payroll contributions depending on state programs. [6]
Local Payroll Taxes
8) Local Payroll Taxes
Local Payroll taxes aren’t universal, however, they do exist and some cities and counties impose payroll-based taxes (often framed as employer payroll expense taxes). Local payroll taxes exist in a few jurisdictions and are highly location specific.
How the Math Works
For most W-2 workers (not self-employed), Payroll Taxes are calculated based on covered wages, and the amounts are split into:
EMPLOYEE Withholding: Social Security, Medicare, and possibly Additional Medicare Tax
EMPLOYER Paid Payroll Taxes: Employer match for Social Security and Medicare, plus FUTA and State/Local Employer Payroll taxes. [2] [3]
If you remember one thing: your paystub shows the employee side, but employers typically pay meaningful payroll taxes on your behalf on top of your gross wage that you never see on your pay stub. [3]
Payroll Tax Calculator
Try our Payroll Tax Calculator to estimate your Payroll Taxes*
Employer Paid Payroll Taxes
Payroll taxes are often discussed like they’re only the amounts withheld from your paycheck. That’s incomplete. Whether you know it or not, Employers are required to pay significant portions of Payroll taxes on your behalf.
Employers typically pay:
Employer Social Security: 6.2% up to the wage base. [1]
Employer Medicare: 1.45% on all covered wages. [2]
Federal Unemployment Tax Act (FUTA): employer-only federal unemployment tax, subject to credits. [5]
State Unemployment Insurance/Unemployment Insurance (SUI/UI): and other state/local payroll programs: usually employer-paid and highly variable. [6]
Why this matters for workers: the employer share affects the total cost of employing someone. Over time, employers tend to think in “all-in” labor cost terms (wages + payroll taxes + benefits). You don’t need an economics lecture to see the implication: if the employer’s cost of employing a worker rises, that can influence wage offers, hiring decisions, depress future wage growth, or how compensation is allocated between cash wages and benefits.
*NOTE – Self-employed generally pay self-employment tax (Self-Employment Contributions Act – SECA) that roughly covers both employee + employer halves of Social Security and Medicare.
Where do Payroll Taxes fit?
Payroll taxes are a major source of Revenue in the Federal budget. A Congressional Research Service overview reports that in FY2023, payroll taxes generated $1.6 trillion, or 36% of total Federal revenue, making Payroll taxes the second-largest revenue source after individual income taxes. [8]
Because payroll taxes are such a large source of federal revenue, they’re central to how Social Security and Medicare are financed. Even small changes to payroll tax rates or the wage base can meaningfully change how much money those programs bring in over time.
Payroll Taxes are often Regressive
A tax is commonly called regressive when lower-income households pay a higher share of their income in that tax than higher-income households. It doesn’t mean they pay more or a higher rate, but as a percentage of their income it represents a higher share. Payroll taxes often fit that description, mainly because of how Social Security is structured and how different households earn income.
Two key drivers:
The Social Security wage cap. Social Security tax applies only up to an annual wage base. Above the wage base cap limit, the 6.2% employee tax stops (and the employer match stops too), which lowers the effective Social Security tax rate as wages rise beyond the cap. [1]
Payroll taxes focus on wages. Payroll taxes generally apply to wage and salary income, not to most investment income (such as capital gains), which tends to be a larger share of income for higher-income households. [9]
There’s an important nuance: Medicare taxes are less regressive than Social Security taxes because Medicare has no wage cap and includes an additional surtax above certain thresholds. [2] [4] That doesn’t eliminate regressivity overall, but it changes the shape: the “cap effect” is primarily a Social Security issue.
Payroll Taxes FAQ
Why did my Social Security withholding stop late in the year? Because Social Security tax applies only up to the annual wage base. In 2026, the wage base is $184,500. [1]
Why does Medicare keep being withheld even after Social Security stops? Because Medicare has no wage cap; it applies to all covered wages. [2]
Why did my employer start withholding an extra 0.9% Medicare tax? Because employers must withhold Additional Medicare Tax once wages paid by that employer exceed $200,000 in the calendar year. [4]
If I have two jobs, can I pay too much Social Security tax? Yes. Each employer withholds up to the wage base as if it’s your only job. Over-withheld Social Security across multiple employers is handled as a credit/refund on Form 1040. [2]
Are bonuses subject to payroll taxes? In general, most cash compensation treated as wages is subject to Social Security and Medicare under IRS wage rules, with specifics governed by employer payroll guidance. [3]
Do independent contractors pay payroll taxes? Contractors generally don’t have payroll withholding like W-2 employees, but they may owe self-employment taxes and make estimated tax payments depending on their situation. [3]
Summary
Payroll taxes were introduced during the Great Depression part of the New Deal and fund core social insurance and unemployment programs and make up a major component of the American Social Safety net. Both you and your employer pay into these programs. Your employer treats these payments as part of your total compensation and benefits. They include what you see withheld from your paycheck and a significant employer paid amount that usually isn’t visible. Payroll taxes are the second largest source of Federal revenue after Income taxes.
U.S. Department of Labor, Employment and Training Administration. n.d. “Unemployment Insurance Tax Topic.” Office of Unemployment Insurance. Retrieved February 14, 2026 (https://oui.doleta.gov/unemploy/uitaxtopic.asp).
Congressional Research Service. 2024. Overview of the Federal Tax System in 2024. R48313. Washington, DC: Congressional Research Service. Retrieved February 14, 2026 (https://www.congress.gov/crs-product/R48313).
*Estimate Only – for illustration purposes only, should not be used as an official use. Contact your Accountant or Tax professional for guidance. The Tax Project Institute is not a Government entity, and not associated with the IRS, Social Security Administration, or Medicare.
The US Federal budget appears as something Congress actively “sets” each year. In reality, a growing share runs on autopilot – governed by laws passed in prior years and by interest costs tied to past borrowing. That shift matters because it reduces flexibility. When the adjustable slice gets smaller, even well-intentioned efforts to “balance the budget,” “cut waste,” or “fund new priorities” run into a hard constraint: there is less room to move without changing the underlying laws. [1][2]
Office of Management and Budget (OMB) historical data shows a long, clear trend: discretionary spending used to represent most Federal outlays (spending) as recently as the 1960s, and today it represents roughly a quarter. [2] Figure 1 illustrates the same core idea: over time, the “annual choice” (a.k.a. Discretionary) portion shrinks while Mandatory spending and Net Interest take up more and more of the total.
Figure 1. Discretionary vs Mandatory & Net Interest (share of total federal outlays).
Figure 1: US Federal Budget Discretionary % Source: OMB
As the Discretionary component of the budget continues to shrink as a percentage of the budget Congress is left with less flexibility, and fewer tools to combat Fiscal challenges. While this was done intentionally in many cases to ensure that funding for critical programs like Social Security, and Medicare are funded, it has the effect of hamstringing the legislative branch in a number of ways.
1) Smaller Steering Wheel
Discretionary spending is the part of the budget Congress decides through the annual appropriations process. It funds many of the visible functions people associate with government: agencies, staffing, operations, contracts, grants, and a wide range of public services. [3]
As discretionary becomes a smaller share of total outlays, the annual appropriations process controls less of the overall budget. Congress is still making choices, but with fewer degrees of freedom – all but roughly one quarter of the budget is on auto pilot before they even start. The practical result is simple: fewer options exist inside the discretionary part of the budget that can be changed quickly without changing the law.
This is the first flexibility problem. Many public debates treat the entire budget as negotiable every year. It is not. A rising share is effectively pre-committed by statute and by the interest payments on our National Debt. [2][3] Because of this there is less room to swing, move budget to areas that may require it without taking on additional debt, and larger budget deficits.
2) “Automatic” but not “Unchangeable”
Mandatory spending runs based on permanent law: eligibility rules, benefit formulas, payment rates, and automatic adjustments. It does not require an annual appropriations vote to continue. [3] These are essentially the auto pilot components of the Federal Budget.
However, Mandatory spending can be changed. The challenge is that it usually requires changing the underlying statute, which often involves complex policy design, distributional tradeoffs, and longer legislative timelines often met with gridlock in our current political environment. That makes it harder to adjust Mandatory programs as a “quick fix” when budget pressure arises.
This creates a mismatch between politics and mechanics: discretionary levels can be adjusted in annual funding bills, while major changes to large mandatory programs, that take up the majority of the budget, typically require separate authorizing legislation and sustained political agreement. [3] This has the practical effect of making most of the budget off limits each year unless there is consensus on changing components of the mandatory budget, which both parties are often hesitant to do.
3) Entitlements Growth
A major reason the autopilot share grows is that many Mandatory programs are built to scale and expand cost automatically. Spending can rise because:
More people become eligible (demographics)
Per-person costs rise (especially in health care)
Benefit formulas and thresholds adjust over time (indexing, inflation)
Refundable credits and income-tested benefits expand and contract with economic conditions [4]
This is not inherently “good” or “bad.” It is what happens when programs are designed to deliver stable benefits based on rules. But it does mean the budget baseline rises even if Congress takes no new action in a given year.
When that baseline grows faster than revenues, pressure concentrates on the smaller discretionary slice. The consequences show up in visible ways: funding fights, recurring rhetoric about “cuts,” and a sense that budgeting is constant crisis management. The underlying driver is often structural: the baseline is doing what the laws tell it to do. [2][4] The challenge is that the Entitlements component of the budget, in particular Health Care, has grown dramatically over the last few decades and is taking an increasingly larger piece of the budget.
4) Net Interest competes with everything else
Net interest is the cost of financing the US National Debt, in other words the interest paid on the National Debt in the form of Treasury securities (net of certain interest income). [3] It is not a program most people interact with directly, but it draws from the same pool of Federal Budget resources.
When debt levels are high and interest rates rise, interest costs can increase even if no benefit is expanded and no agency is funded more. That creates a second flexibility squeeze: interest is effectively a prior obligation. It gets paid first, and it reduces the dollars available for everything else. The US paid over $1 trillion in Interest on our National Debt, more than the entire US Military budget. [5]
This is one reason budget debates can feel increasingly zero-sum. When more of the budget is committed to mandatory programs and interest, the share left for annual choices becomes smaller, and tradeoffs become more challenging. [2][3]
5) Limited Efficiency Drives
Efforts to improve government efficiency, reduce overhead, and cut waste matter. But they run into arithmetic challenge, even if they eliminated the entire Discretionary budget, roughly three quarters of spending would still occur. While this isn’t practical, or likely, it provides perspective on the limitations of any cost cutting efforts, including the most recent DOGE efforts.
When discretionary spending is only roughly a quarter of federal outlays, it limits how large savings can be if reforms stay mostly inside discretionary programs. Even aggressive discretionary cuts face tradeoffs because discretionary spending includes many visible services and operational functions people rely on. [2][3] The discretionary budget includes many things that would probably surprise many citizens that they are discretionary including Education, the Military, Homeland Security, housing assistance, and medical programs like the CDC, and NIH to name just a few.
Meanwhile, the biggest structural drivers of the budget’s composition shift sit mostly in Mandatory programs and Net interest – areas that do not respond to short-term “efficiency” campaigns in the same way. [2][3]
That is why many high-profile cost-cutting efforts generate headlines but produce smaller results than promised: the biggest budget pressures are often located in the portions that require statutory change or longer-term fiscal adjustments.
What this means for citizens watching budget debates
The practical takeaway is straightforward: the annual budget fight is real, but it is increasingly a fight over a smaller share of total federal spending that limits Congressional flexibility. Big claims about “fixing the budget” without addressing larger Mandatory programs and Net Interest costs should be treated with skepticism – not because reform is impossible, but because the control levers are different. [2][3]
A budget with less discretionary share has less flexibility. That makes it harder to:
Respond quickly to new priorities without borrowing and increasing deficits adding to the National Debt
Reduce deficits through easy cuts
Avoid political brinkmanship in appropriations
Hold decision-makers accountable for the full budget (because only part is voted on annually) [2][3]
The budget autopilot challenge is fundamentally a governance challenge: when most spending is determined outside the annual appropriations cycle, meaningful change requires changing the rules – not just negotiating the yearly slice. [3] The growth of Entitlements and Mandatory spending and Interest are putting more an more pressure on the Fiscal Budget each year, leading to annual structural deficits in budget over $1 trillion a year. In FY 2025 the US Federal Budget was $7 trillion on revenue of $5.2 trillion with a $1.8 trillion deficit added to the $38 trillion National Debt. [6] The long term trend is clear, growing Mandatory spending will continue to consume more and more of the budget and lead to increasingly structural deficits which will compound the challenge as interest payments and entitlements continue to grow. Meaningful change will likely require adjustments to Mandatory programs and reduction in annual deficits through spending cuts and/or tax increases. See our article on Ways out of Debt HERE.
See how well you understand the Finances of America. Every American should understand the basic components of how our Government manages the finances of the Country. Only through knowledge are we able to understand the financial state of the country, and thus the health of the country and from this knowledge the ability to make informed decisions.
“Knowledge will forever govern ignorance; and a people who mean to be their own governors must arm themselves with the power which knowledge gives.”
James Madison
Test Government Finance Knowledge
About how much Revenue does the U.S. Federal government collect in a typical recent year?
Order of magnitude: Federal revenues are in the mid single-digit trillions, not billions. For example, in Fiscal year 2024 the federal government collected about $4.9 trillion in revenue. That was just under 20% of U.S. GDP for that year. Learn more: Federal Revenue overview.
Social Security is a Pay-as-You-Go (PAYGO) system. It is a common misconception that Social Security acts like other investment/retirement accounts that individuals pay into and grow over time. Social Security instead relies on Payroll taxes from today’s workers to finance benefits for today’s retirees, survivors, and disabled workers. The Social Security Trust funds act as a small buffer, but long-run solvency depends mostly on the flow of contributions from current workers outpacing the flow of benefits to current recipients and not on a large pool of invested assets that many believe.
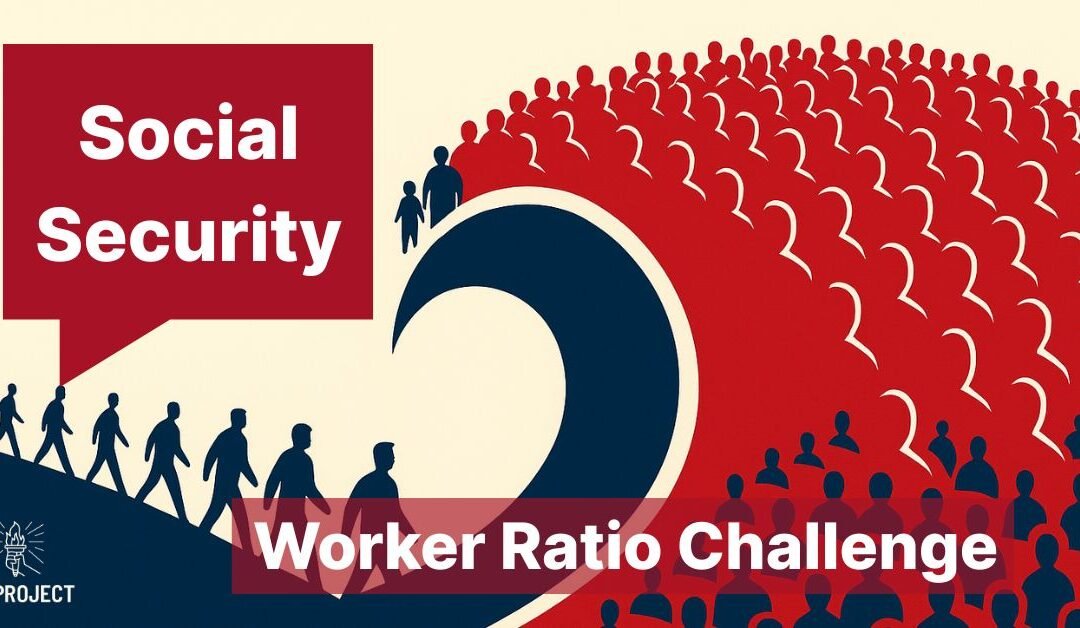
Workers vs. Beneficiaries – The Ratio Math Challenge
Because PAYGO relies on current payrolls, the program’s sustainability is tightly coupled to how many people are paying in relative to how many are receiving. In fact, the system requires several workers per beneficiary in order to keep up with current program expenses. The less workers per beneficiary, the more challenging the finances are for the entire program.
Key Social Security Metrics :
Covered workers (Payers), 2024:~184.0M
Beneficiaries, 2024:~67.9M
Workers per beneficiary, 2024:~2.71 : 1
Workers per beneficiary, 1945:~41.94 : 1
Disability Insurance (DI) share, 2024:~8.3M beneficiaries, ~1/8 of total OASDI
The chart (“Workers to Beneficiaries”) captures the same story: a steady rise in beneficiaries alongside a slower-growing base of covered workers, driving the ratio down from ~42 to ~2.7 over eight decades. Obviously, this is not a favorable trend for Social Security solvency.
Program Sustainability
In a PAYGO system, the ratio of Workers to Beneficiaries is critical – too few and the program runs into challenging finances that don’t work without altering the program. To maintain a steady state Revenue from Worker’s Payroll taxes must equal of exceed Payments to Beneficiaries.
Formula: (Payroll tax rate × Average covered wage × Number of workers) ≈ (Average benefit × Number of beneficiaries)
If wages and tax rates remain constant, a lower workers-to-beneficiary ratio means less revenue per beneficiary. This has long been the 3rd rail of politics that most policymakers do not want to touch – understandably, people who have worked a lifetime with a set of promises and expectations aren’t likely to be happy with reduced Payments, or higher Taxes. However, in order to keep balance, that is exactly what Policymakers must do if the number of workers per beneficiary drops. Policy Makers would be left with making tough decisions to pull one or more of these levers:
Raise Taxes – This could be done with some combination of increases to tax rate, increases in taxable maximum, or greater enforcement.
Reduce Benefits – This could be achieved by reducing benefits, increasing eligibility age, or across-the-board adjustments.
Transfer Resources – This could be done by taking funds from other parts of the budget, and/or taking on more debt.
Improve the Ratio – This would require adding Workers via higher labor-force participation or immigration or reducing Beneficiaries.
What’s been Changing
Social Securities has a number of long running challenges that are not easily overcome that challenge the program solvency and viability. At the end of the day, Social Security is backed by the full faith and credit of the United States, and its unlimited ability to Tax. So Social Security will not go away, but if these macro challenges are not resolved there will likely be changes to the program. Three long-running demographic forces explain most of the ratio’s decline:
Population Aging: The cohort of younger workers is smaller than the cohort or near retirees lowering the ratio of workers to beneficiaries.
Longevity Gains: People are living longer and beneficiaries are collecting for longer.
Lower Fertility: Americans are having fewer children which means less new workers per retiree over time.
Some people use the saying Demographics is Destiny – and these challenges will put additional strain on Social Security viability. The Payroll Taxes for Old Age, Survivors, and Disability Insurance that funds Social Security (OASDI) also includes Disability Insurance (DI) that adds another dimension. With ~8.3M people on Disability Insurance (~12% of beneficiaries), disability incidence and program rules also affect total beneficiary counts and outlays. See our Article on Privatizing Social Security to see the Demographic, and Unfunded Liabilities Challenges.
Bottom line
Social Security (OASDI) works as designed when many workers support each beneficiary. As this ratio has continued to drop from ~42:1 (1945) to ~2.7:1 (2024) and as current Demographic and Longevity changes manifest this will compress Social Securities PAYGO margins, which is why the program’s long-term outlook likely hinges on policy choices that either raise taxes, reduce benefit growth, or find a way to increase the worker base. The mechanics are clear: sustainability is, above all, a Ratio Math problem.
References
[1] SSA, 2025 OASDI Trustees Report, Table IV.B3 “Covered Workers and Beneficiaries, Calendar Years 1945–2100” (historical rows used for 1945–2024).
Inflation is the silent force that eats away at your purchasing power every day. It does not sleep, it does not rest, it keeps coming all the time. It reduces the value of your savings, and eats at your pocketbook every time you buy something. For most Americans that word enters your household through price tags at the store, the rent due each month, or the spikes in utility, subscription, and insurance bills. Headlines tell different stories like “inflation is going through the roof” or “Inflation is easing”, sometimes at the same time! Yet, even when the rate slows, the prices remain higher than before, and individual experiences can diverge sharply from official reports. The news often comes with confusing terms like Headline Inflation, or Core Inflation and they discuss it in “nominal” and “real” terms or use acronyms like CPI and PCE. If you’re confused, you are NOT alone. This is the language used by Economists, Investment Bankers, and Central Bank figures that are looking to measure different parts of inflation, trying to be as accurate as possible. This article dives into those areas to help explain inflation metrics, so you can understand what is happening, why, and how each of these terms are used so hopefully you can make more informed decisions.
What is Inflation?
To help set a baseline for our discussion, lets define inflation. Here is how Webster’s Dictionary defines Inflation:
2 : a continuing rise in the general price level usually attributed to an increase in the volume of money and credit relative to available goods and services
In simple terms, inflation is an increase in the cost of goods and services. As prices increase, the purchasing power of your money decreases. When inflation is low and prices are stable that is thought to be good overall. It helps businesses stabilize labor costs, and lowers the value of debt. However, higher or more volatile inflation is something that negatively impacts everyone, and governments and central banks around the world pay close attention to inflation to order to manage it careful to ensure stable prices. Economist use a few different terms to describe why inflation is occurring.
Demand Pull – When there is high demand, and demand exceeds supply prices increase. You can see this effect in action around Christmas time when the latest game console, or in demand toy is hard to find and prices jump dramatically. Some of the causes:
Higher consumer demand and spending
Increased Money Supply
Government Spending
Cost Push – When the supply cost to produce goods and services increase suppliers pass these costs onto consumers. You saw this in the 70’s with the oil embargo, and during COVID with the supply chain issues. Some of the causes:
Higher Material Costs
Higher Wages/Labor Costs
Increased Taxes or Regulations
Disruptions in the Supply Chain
Why Inflation Feels Different Than the Headlines
When you watch the news and they say inflation is up, and they give a number or that it is dropping – if that feels different than what you are experiencing, you are not alone. Every person has their own lived reality, where you live, where you work, your life style, your spending mix (groceries, housing, gas, health care, etc.) are all different and they matter when it comes to how inflation is impacting you. Unsurprisingly, you are unique, and the challenge with metrics is that they attempt to capture large swaths of different areas that produce data that turn into macro metrics that are supposed to represent different groups that may have little to do with your unique situation. For example is you are an professional in finance or technology in an urban metro center than there maybe a higher likelihood of you being a closer match to the CPI Urban index (CPI-U) than someone in a Rural area in the Agriculture, or Manufacturing sector who may more closely track to the CPI Wage Earners and Clerical Workers (CPI-W) index.
Most recently in 2024 we had some significant increases in inflation in a short period. When inflation has a period of rapid rise like that, and then cools off and the rate of inflation slows, you are still at a higher price base than before even if the rate of inflation is lowering. It is little consolation when Politicians say inflation is lowering when costs have already risen and your wages haven’t kept up. So in part, the challenges with inflation are both a communication issue in how to empathize and understand someone’s individual experience with inflation and a technical one on how to capture that impact with metrics and data. This is not to say that the hard working and intelligent people capturing this data are wrong, these metrics are useful at capturing macro level changes over time that are helpful to guide decisions and course corrections for the nation overall. However, in the context of if they match your experience, sometimes for a great number of people, they often do not. In fact there are many articles and stories of exactly the same, and some groups have even created their own tracking that shows some of the disconnect and are worth further review. Here are a few terms to help you understand the inflation landscape, and what they mean.
Inflation Concepts
Headline vs. Core Inflation
When the News mentions inflation, it’s usually referring to “Headline” inflation – the total change in prices for all goods and services tracked by an index known as the Consumer Price Index or CPI. Sometimes they will differentiate and use the word “Core” inflation and this is the same as CPI except it excludes food and energy prices and is known as Core CPI. Why the need? Because those categories (food and energy) tend to have volatile pricing, and to understand the underlying trends of inflation as a whole Economists want to remove the noisy volatile part to see if everything else is rising or just the volatile components. Policymakers use Core inflation to judge long-term patterns, knowing that food and energy prices swing widely with supply shocks, global events, or weather.
Real vs. Nominal: The Dollars You See vs. Your True Buying Power
Two simple but critical terms you should know to help you understand inflation’s impact and how Policy and Economists discuss inflation: “Nominal” refers to the actual dollar amounts seen in your paychecks and bills. This is the non Inflation adjusted amount, and the prices you see every day. While “Real” means the dollars after adjusting for price changes, this is the Inflation adjusted amount. If your wages go up 4% but inflation rises by 3%, the Real increase in purchasing power is only 1%. Real Inflation indexes allow economists, government agencies, and citizens to compare the true value of money over time. For example the purchasing power of $1 in 1930 was the equivalent of $19.34 in 2025 dollars.
Seasonal vs Non Seasonally Adjusted
Similar to Real and Nominal, Seasonal and Non Seasonal are adjustments to the inflation data but are not made for the impact of inflation over periods of time but seasonally within a year due to different buying habits and supply differences each season. Non Seasonally Adjusted (NSA) inflation numbers are the raw numbers they do not adjust for inflation. If Gasoline prices are higher in summer because more people are driving, they do not adjust them. Similarly if fresh produce food prices drop in summer because of abundant supply during the summer months, or if energy prices increase during winter when more people are consuming for heat they do not adjust. Seasonally Adjusted (SA) inflation prices are adjusted, and statistical methods are used try to smooth out and normalize these seasonal difference. This is the number used by most economist and policy makers as it gives a more stable reading of inflation without seasonality.
Chained vs Fixed (Unchained) Weighting
Chained and Fixed Weighting are both methods to capture inflation but they differ in how they measure consumer behavior when prices change. Specifically the substitution effect, or when the price changes does user behavior change with it or does it stay the same and the answer to that question determines the weighting. For example, if beef prices rose dramatically it is reasonable to assume that there maybe some consumer behavior shifts causing some to substitute chicken versus beef. Chained Weighting would evaluate that type of change and not overweight beef, and capture the change in consumer behavior. On the other hand Fixed Weighting remains the same, and does take into account possible changes in user behavior.
Inflation Metrics
One of the most confusing parts of inflation is how it is measured and tracked, not just the terminology but also the fact that there are so many different ways to measure and track it. When you someone mentions inflation they are probably talking about Headline inflation, but not always and these terms are thrown around all the time in different contexts. In the United States there are over a dozen different metrics tracking different forms of inflation. Fortunately, we’re going to help break it all down for you – we’ll discuss each of the individual metrics, and the groupings and who produces them and what they represent. To start the most prevalent metrics in use for inflation are from the U.S. Government, and they primarily come from 2 agencies. The first is the Bureau of Labor and Statistics (BLS) an agency within the Department of Labor. They produce the most common metric known as the Consumer Price Index (CPI) known as the “Headline” inflation metric. The other major agency is the Bureau of Economic Analysis (BEA) an agency within the Department of Commerce. They produce the Personal Consumption Expenditures (PCE) metrics, often used by other agencies like the Federal Reserve. Each of these major metrics (CPI and PCE) has groups of related metrics that provide different variations to help Economists understand the nature of inflation from different angles. Here are the major groupings:
CPI (Consumer Price Index): The CPI grouping of metrics is calculated by the Bureau of Labor Statistics (BLS), the index tracks the cost of a fixed basket of goods and services bought by urban households. There are a few versions of CPI, but when someone says CPI generically, or Headline inflation, or just Inflation they usually are using CPI-U which is for all urban consumers; There is another metric that tracks urban Wager Earners & Clerical workers called CPI-W is used to adjust Social Security payments. It is a subset of CPI-U that tracks the price changes specific to those who work in clerical, sales, craft, service, or other blue-collar occupations. They are not salaried professionals, managers, or self-employed. This was originally created in the early 19th century to track industrial workers.
CPI Methodology
Direct costs – focus on out of pocket, direct expenses
Fixed Basket – constant weighting of basket of goods over 2 years
Collection Method: Household survey
PCE (Personal Consumption Expenditures): This index, preferred by the Federal Reserve, is managed by the Bureau of Economic Analysis (BEA). It covers direct and indirect expenses (like employer-paid health insurance), updates spending patterns more frequently, and uses “chain-weighting” to reflect how buyers substitute when prices shift. Because of this dynamic approach, and that it captures more of the cost it is the reason why the Fed uses it to more accurately model people’s behavior.
PCE Methodology
Direct & Indirect costs – capture out of pocket costs and other employer paid expenses like Medicare.
Chained Weighting – adjust the basket of good to weight for changing consumer habits. If beef prices go up and people substitute chicken, PCE captures the shift in behavior and does not overweight beef.
Collection Method: Business survey
Producer Price Index (PPI): This index tracks prices received by businesses for their output, not what consumers pay, but what companies charge producers (Business to Business). This measures what business pay for supplies wholesale before the retail/consumer market. Often called the “Factory Gate” Index because it measures the cost inputs for supplies to business before they are distributed to consumers. This is often considered a leading indicator as PPI often shows price pressure before reaching consumers.
GDP Price Index & Gross Domestic Purchases Index:
GDP Price Index measures inflation by capturing changes in the prices of all goods and services produced within the United States, including exports but excluding imports. It reflects the cost of production and output of the national economy, helping assess real economic growth by adjusting for inflation by what the country produces.
Gross Domestic Purchases Price Index measures the prices of all goods and services purchased by U.S. residents, including imports but excluding exports. It provides a broader view of inflation from the perspective of what Americans actually buy, capturing price changes in domestic and foreign goods and services consumed within the country.
Types of Inflation Metrics
This table provides a summary of the different Inflation metrics in the US (there are many more, but these are the primary). Importantly, it gives a description of what it is used for and what it covers. It has a description of the products that are covered (often called the basket of good) and how it is weighted (The percentage amount of each category in the metric). From this you can get a better sense of how the metrics are derived, and which impact you most, and how they might changed based on different inputs.
Who
Date
Index
Index Name
Description
Used For
# of Products
How it is weighted
BLS
1978
CPI-U
Consumer Price Index for All Urban Consumers
Price change for a fixed basket of goods & services purchased by urban consumers (~93% of U.S. population).
Headline inflation, Index of Private Contracts/Leases, Treasury TIPs, Federal Poverty level used by Census, some States index for minimum wage
CPI excluding food & energy to view underlying trend.
Used to track the underlying inflation trend by excluding food and energy, helping the Fed and analysts assess persistent inflation for policy and forecasting.
Prices received by domestic producers for output (goods, services, construction).
Tracks the prices businesses receive for goods and services; used to gauge upstream inflation and input cost pressures, set index-linked contract adjustments, and help forecast consumer price trends.
Prices for all goods & services purchased by/for U.S. households (national accounts).
The inflation measure the Fed watches most; it shows how fast household prices are rising and is used to strip inflation out of consumer spending numbers.
The Fed’s main gauge of underlying inflation, excluding food and energy, to judge persistent price pressures and guide interest rate decisions; also used to strip inflation out of consumer spending data.
PCE price index excluding most estimated components; uses observed market transactions.
A version of PCE that uses only actual transaction prices and leaves out items with only estimated prices. Used as a cleaner cross-check on inflation and for clearer inflation-adjusted spending.
For detailed information on the basket of goods and their weightings in CPI, or PCE expenditure breakdowns in more detail see these.
BLS Relative Importance Tables (CPI Category Weights): https://www.bls.gov/cpi/tables/relative-importance/ This page provides detailed tables showing the relative importance (weight) of CPI components for various CPI versions.
Consumer Price Index (CPI-U) and Core Consumer Price Index (Core CPI)
Personal Consumption Expenditures (PCE) and Core Personal Consumption Expenditures (Core PCE)
Who Uses Which Index and Why?
Our Government and various organizations use different metrics for various components that effect American’s everyday lives. Here is a cheat sheet of who uses what?
Who
What they use it for
News Agencies and Media
CPI and CPI-U – Headline inflation number to report on Inflation to public
Social Security
Uses CPI-W for annual cost-of-living adjustments, matching legislation to beneficiary spending patterns.
Tax Code
Federal income tax brackets and thresholds are updated using chained CPI-U to keep pace with inflation over time.
Federal Reserve
Targets core PCE inflation for monetary policy. The Chain Weighted basket of goods more closely mimics consumer behavior and includes both direct and indirect inputs.
Treasury
The Treasury offers inflation protected securities (TIPs and I Bonds) that use non seasonally adjusted CPI-U for inflation adjustments. Understanding this rate can help you evaluate your securities.
US Census
The Census uses CPI-U to update poverty thresholds annually.
National Economic Accounts
Use PCE and GDP deflators to convert raw dollar figures into inflation-adjusted series.
Table 2 Agency Use Cases
How to Pick the Right Index for Your Situation
Here is a cheat sheet of how to use the different metrics and which one might be appropriate for what you are trying to understand.
Your Interest
Metric
Descripton
Your expenses and wages against inflation
CPI-U
If tracking personal expenses or comparing wages/paychecks against inflation, CPI-U is the most direct yardstick.
Your expenses and wages against inflation for industrial, non salaried work
CPI-W
CPI-W more closes tracks expenses for non salaried, non managerial positions.
Social Security COLA adjustments
CPI-W
For retirees, Social Security COLA is based on CPI-W and may differ from personal cost patterns.
Small Business Planning
CPI-U and PPI
Small businesses should compare CPI-U for their costs and PPI for their sales prices.
Landlord, Property Owners for Leases
CPI-U and CPI-W
Landlords or contract writers use CPI-U or CPI-W, depending on their lease or agreement.
Financial Planning
PCE
For financial planning, PCE is preferred for broad purchasing power trends.
Table 3 Personal Inflation Cheat Sheet
Why Multiple Indexes?
No single metric can capture the full range of price changes, consumer habits, and economic shifts. CPI is best for consistent, out-of-pocket price trends. PCE adapts to the complexity of actual consumer behavior, including employer and government paid expenses. PPI shows upstream price pressures from Producers that may end up in Consumer prices via Cost Push inflation. GDP-related indexes help economists and forecasters look at the big picture to understand real Growth versus Inflation. Each is used for decisions that would be ill-served by a “one index fits all” approach.
Summary
Inflation, the terms, the metrics, and way it is discussed and used can be a lot to take in. Hopefully you have a better understanding of the metrics, and how do make sense of them. Knowing that what you feel and what is being reported in the news can and often are different and that is normal even if if it doesn’t make you feel like it represents you. Hopefully you have a better understanding and can recognize which metric is being cited, understanding how it is calculated, and if it is the best for your situation. You should now be able to read inflation news and be able to think critically and understand if it is accurately representing your current economic situation and the country as a whole.
Tax Project Institute is a fiscally sponsored project of MarinLink, a California non-profit corporation exempt from federal tax under section 501(c)(3) of the Internal Revenue Service #20-0879422.