How the U.S. Could Reduce Debt Without Breaking the Economy
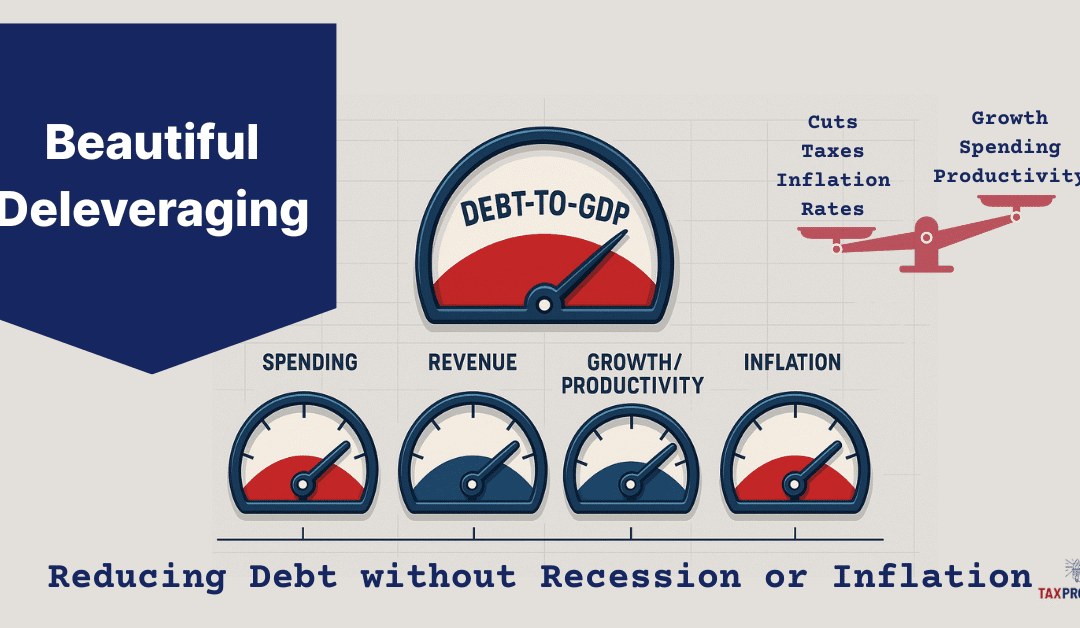
The U.S. National Debt just passed $38 trillion according to the US Treasury’s Debt to the Penny. [1][2] Not all debt is bad, but if it gets too large then debt can matter a lot, even those denominated in a fiat currency, because interest costs compound and grow they can crowd out other national priorities. Growing up your parents may have told you that it’s a lot easier to get into something, then to get out. That is especially true for debt, easy to get in, and painful to get out. Now that we have reached the point where interest payments are over $1 trillion annually, the US has crossed into that uncomfortable territory. The real challenge is to bring debt growth under control without causing a recession or a bout of high inflation. Ray Dalio, a billionaire hedge fund manager who has written books on Why Nations Succeed and Fail, and How Countries go Broke, popularized the idea of a “Beautiful Deleveraging” – a balanced, multi-year process that reduces the painful process of deleveraging when lowering debt burdens through a mix of growth, moderate inflation, controlled austerity, and targeted debt adjustments, rather than a painful deleveraging that could lead to recession, extreme reductions in services, tax increases, and austerity measures. [3][4]
This piece frames what a Beautiful Deleveraging could look like for the United States, why it’s hard, the challenges faced, and how policy could balance the Deflationary forces of tightening with the Inflationary tools sometimes used to ease the adjustment—aiming for a soft landing that improves the country’s long-run fiscal and economic health, while minimizing the pain along the way.
Current Status
National Debt: The National Debt stands at just over $38 trillion (gross) with over $30 trillion of which is Debt held by the public. [2]
Deficits: Structural Annual deficits running over $1trillion at around ~6% of GDP. [5][6]
Interest Costs: Net Interest over $1 trillion annually. The Congressional Budget Office (CBO) Long-Term Budget Outlook (March 2025), Net Interest reaches 5.4% of GDP by 2055, up from ~3.2% of GDP around 2025. [7][8] Independent analysis by the Committee for a Responsible Federal Budget (CRFB) highlights a related pressure point: by the 2050s, net interest would consume roughly 28% of federal revenues, absent policy changes. [9]
According to CBO’s latest long-term outlook, by 2055 total Federal outlays (spending) are projected at about 26.6% of GDP, with Net Interest (interest paid on National Debt) near 5.4% of GDP. That means that roughly one-fifth (~20%) of Federal spending will be used to pay interest on the debt. At that scale, interest costs rival or exceed most standalone programs and risk crowding out other priorities if unaddressed. [7][8][9]
What “Beautiful Deleveraging” Means
In Economic terms, Beauty is about reducing debt while avoiding (or at least minimizing) the painful parts of deleveraging and therefore managing that successfully can be Beautiful. Dalio’s Deleveraging framework was originally developed to explain past debt cycles and emphasizes a balanced mix of tools so that the economy can reduce debt without crashing demand and involves these components:
Spending Restraint (public and private demand constraint),
Income growth (real GDP growth),
Debt Restructuring or Terming out (Monetary intervention when necessary), and
A measured amount of Money/Credit creation (Moderating and managing inflation).
These components, when executed with great skill, political courage, and balance, can help the economy grow enough to ease debt ratios while avoiding a deflationary spiral. [3][4]
For a sovereign like the U.S., that balance translates into a policy with credible fiscal consolidation, productivity-oriented growth policies, and a monetary policy that avoids both runaway inflation and hard-landing deflation. Because the U.S. issues debt in its own currency with deep capital markets, it has more room to maneuver than most, but it is not immune to arithmetic: if interest rates (R) run above growth (G) (See our Article on R > G), debt ratios tend to rise unless deficits are reduced. CBO’s long-term projections foresee precisely this pressure in their future outlook. [9]
Pain Points: Why Deleveraging Is Hard
There is a reason it’s hard, in general large broad spending cuts, and more and higher taxes are not popular. While the components and levers are well known, it takes a healthy amount of political courage to propose policies that maybe unpopular, a great deal of skill and coordination to execute these policies, and likely a good amount of luck and good timing for a sustained period likely across several administrations. A deleveraging can proceed along two of these painful paths, spending cuts and tax increases, and each has tangible real-world consequences:
Spending cuts: Less public consumption and investment, fewer or slower growth in transfers, and potentially fewer (e.g. program eliminatinos) or lower service levels (e.g., processing times, enforcement, infrastructure maintenance). In macro terms, cuts are deflationary, they reduce aggregate demand, which can cool inflation but also growth and employment in the short run.
Tax increases: Higher effective tax rates reduce disposable income and/or after-tax returns to investment, is also deflationary. Design matters: broadening the base (fewer exemptions) generally distorts behavior less than steep marginal rate hikes, but either path tightens demand.
Because both mechanisms have a contractionary/deflationary impact and create conditions that can lead to recession, economic hardship, and job loss, a multi-year consolidation approach is part of Dalio’s framework. Instead of a fiscal cliff and extreme austerity based spending cuts; Dalio’s approach phases changes over time; and pairs tighter budgets with growth-friendly policies (innovation, expansion, permitting, skills, productivity increases) that lift the supply side. The goal is to keep nominal GDP growth (real growth + inflation) from collapsing, otherwise debt-to-GDP can rise even while you cut, because the revenue denominator shrinks.
Deleveraging Menu (and Their Trade-offs)
The Tax Project has outlined (See our Article: “Ways Out of Debt”) a non-exhaustive review of policy options to deleverage. Below we provide a summary group them by mechanism. [10]
1) Consolidation via Revenues (Tax Increases)
Summary: Revenue measures (Tax Increases) are deflationary near-term but can be structured to minimize growth drag (e.g., emphasize consumption/external taxes with offsets, or reduce narrow, low-value tax expenditures).
2) Consolidation via Outlays (Spending Cuts)
Summary: Spending cuts can be deflationary; pairing it with supply-side reforms (education/skills, streamlined permitting for productive investment, R&D incentives, labor force productivity growth) can mitigate growth losses and raise potential output over time.
3) Pro-Growth, Supply-Side Reforms (Growth)
Summary: Growth and Supply side reforms (e.g. Productivity, Innovation, Permitting, Energy inputs) that generate real productive growth is the least painful way to lower debt-to-GDP without relying on high inflation.
4) Inflation and Financial Repression (Print Money)
Summary: Modest inflation can ease real debt burdens, part of Dalio’s balance, while managing highly destructive excess inflation. That is why the “beautiful” approach uses only modest inflation alongside real growth, fiscal and monetary management, not inflation as the main lever. [7][9]
The Sooner we Start, the Easier it is
The bottom line is, the longer we wait the harder it gets, the problem will not go away on its own, it only gets worse over time. The 2025 CBO long-term outlook provides a forecast, and it doesn’t paint a great picture:
Debt Outlook: Debt held by the public rises toward 156% of GDP by 2055, under current-law assumptions. [8][11]
Outlays vs Revenues: Outlays (spending) climbs from ~23.7% of GDP (2024) to 26.6% (2055); revenues rise more slowly to 19.3% – expanding an already large and persistent structural gap. [8][12]
Net interest: Reaches 5.4% of GDP by 2055—roughly one-fifth of total federal outlays and around 28% of Federal revenues. [7][8][9]
Those numbers underscore the reason to start now: the later the adjustment, the harder the challenge required to stabilize debt. Conversely, a timely package that the public views as credible and fair can anchor long-term rates lower than otherwise, reducing the interest burden mechanically.
A “Beautiful” U.S. Deleveraging
The Tax Project does not propose or advocate specific policies, however a workable plan using the Dalio Framework would likely include a mix of the following components aimed to stabilize debt-to-GDP within a decade and then bend it downward while sustaining growth and guarding against excessive inflation relapse. A balanced approach:
A multi-year fiscal framework enacted up front allowing for a ordered and measured deleveraging.
Credible guardrails: Deficit targets linked to the cycle; a primary-balance path that improves gradually, with automatic triggers to correct slippage.
Composition: Roughly balanced between base-broadening revenues and spending growth moderation in the largest programs (phased in).
Quality: Protect high-return public investment; target lower-value spending and tax expenditures first.
Administration: Resource the revenue authority to improve compliance; align incentives and simplify.
A growth package to offset the deflationary impulse.
Supply-side reforms with high ROI: energy and infrastructure permitting; skilled immigration; workforce skills; competition policy that fosters innovation and productivity tools.
Private-sector: Reduce regulatory frictions that impede capex expenditures in goods and critical infrastructure.
Monetary-Fiscal Coordination in the background—not Fiscal Dominance.
Monetary-Fiscal Coordination: The Federal Reserve keeps inflation expectations anchored; it does not finance deficits but it can smooth the adjustment by responding to the real economy and anchoring medium-term inflation near target. Over time, a credible Fiscal policy promoting growth helps bring Rates (R) down toward Growth (G), easing the arithmetic. [7][9]
Contingency tools (use sparingly)
“Terming out” Treasury debt Lock in more fixed, long-term loans and rely a bit less on short-term IOUs. Why it helps: If rates rise, less of the debt has to be refinanced right away, so interest costs don’t spike as fast. If the term premium is reasonable and the Fed is in an accommodative stance, shorter term lower rate treasuries maybe attractive to reduce Net Interest expenses.
Targeted restructuring (not the federal debt—specific borrower groups) Adjust terms for groups where relief prevents bigger damage (e.g., income-based student loan payments, disaster-area mortgage deferrals). Why it helps: Stops small problems from snowballing into defaults and job losses while the government tightens its own budget.
This mix qualifies as “beautiful” by balanacing inflationary and deflationary elements. It shares the burden across levers; it avoids hard financial shocks; it relies primarily on real growth + structural balance rather than high inflation or sudden austerity. Done credibly, long-term rates fall relative to a laissez-faire (do nothing) approach, lowering interest costs directly and via lower risk premia. The country benefits both intermediate (by not inducing a recession and harsh economic measures), and long term freeing up revenue to more productive uses than Debt payments, and supporting growth.
Managing the Macro Balance: Deflation vs Inflation
All this sounds good, but the practical art is to offset deflationary consolidation with pro-growth supply measures, not with high inflation. Consider the balancing act between these different variables:
Consolidation (deflationary): Fiscal discipline reduces demand, manages structural gaps, good for taming inflation; risky for growth if overdone or badly timed.
Growth Reforms (disinflationary over time): Expand supply, lower structural inflation pressure; raise real GDP and productivity, improving the debt to GDP ratio.
Monetary Stance: Should keep inflation expectations managed; if growth softens too much, gradual monetary easing is available if inflation is on target.
Inflation temptation: Modest inflation can reduce some of the burden mechanically, but leaning on inflation as the adjustment tool can backfire if markets demand higher interest rate (term) premiums; nominal rates can rise more than inflation, worsening R > G and Net interest. CBO’s baseline already shows interest outlays rising markedly even without an inflationary strategy. [7][9]
A “Beautiful Deleveraging“ aims too creates a “soft landing” keeping nominal GDP growth positive, inflation expectations managed, and real growth strong enough that debt-to-GDP falls without creating undue Economic hardships. Managing each of these variables with the often blunt tools available, many of which don’t manifest for months, or years is quite the magic trick, requiring patience, skill, and acumen.
Risks and Pitfalls
The road ahead can be bumpy and full of challenges, managing the risks is key to a successful deleveraging. Here are some areas that can derail a “Beautiful Deleveraging.”
Front-loaded austerity that slams demand into a downturn or recession; a gradual path anchored by rules and automatic stabilizers is safer and creates less hardships. It means that we will endure less pain over a longer period. Some may want to rip the band aid off and take the measures all at once.
Policy whiplash (frequent reversals) that destroys credibility and raises risk premia (higher Interest rates); stable consistent policies beat one-off “grand bargains” and political vacillations.
Over-reliance on rosy outlooks; plans should make conservative growth assumptions, and reasonable baselines.
“Kicking the can” down the road with laissez-faire policies until interest dominates the budget, leaving painful, crisis-style adjustments as the only option is the biggest of all the Risks. CBO’s outlooks illustrates how waiting raises the eventual cost, and negative consequences. [7][8][9]
Is it Worth it?
On the surface, that’s an easy question, however the answer may pit generations against each other each with their own point of view and different perspectives. Current generations at or near retirement who may not see the worst effects of a laissez-faire policy may see the risk of recession, and cut backs in service as an unacceptable change to their Social Contract which they may have worked a lifetime under a set of expectations that they counted on. Younger generations, may see it as generational theft, placing an undue burden on them for debt they had little or no part in creating. Both are valid perspectives, however, the long term effects of a “Beautiful Deleveraging” will deliver these positive durable payoffs for the Country:
Out of Doom Loop: High debt is a trap, as out of control interest expenses rise, debt grows and the gap between revenue and debt rises in a self reinforcing doom loop. Breaking that loop is key to a healthy economy.
Lower Interest burden: As debt drops, so does Net Interest expenses. Instead of crowding out other expenses, revenue is freed up to other National Priorities (e.g. Healthcare, Education, Infrastructure, Social Services, Surplus, Sovereign Wealth). [7][9]
Greater Macro resilience: With manageable debt exogenic shocks, pandemics, wars, financial events, give the Government financial space to manage these events without taking on negative levels of debt.
Higher Trend growth: When consolidation is paired with genuine productivity reforms, lower debt ratios are correlated with higher growth, supporting living standards and the tax base. [14][15][16]
Summary
A “Beautiful Deleveraging” is but one way to approach the intractable problem of high debt. It represents a reasonable approach that balances near term realities with long term impacts. Our choices now will define the America of the future, and the quality of life younger Americans will have and future generations will inherit. Will it be painless? Probably not, it will likely require some sacrifice and discipline. The challenge wasn’t created in a short period, and it won’t be solved in a short period. Is it achievable? If we face the truth with candor about trade-offs, accept phased steps that the public deems fair, and have a bias toward investments that raise long-term productive capacity, than it is possible. The biggest question is the will of the American people. That, more than any single policy, will determine our future. At the Tax Project we will always bet on informed Citizens making the best choices for America – we will always bet on America. That defines the essence of a “Beautiful Deleveraging.” [3][4][10]
Citations
[1] U.S. Department of the Treasury, America’s Finance Guide: National Debt (accessed Oct. 2025): “The federal government currently has $37.98 trillion in federal debt.” (fiscaldata.treasury.gov)
[2] Joint Economic Committee (JEC) Debt Dashboard (as of Oct. 3, 2025): Gross debt ~$37.85T; public ~$30.28T; intragovernmental ~$7.57T. (jec.senate.gov)
[3] Ray Dalio, What Is a “Beautiful Deleveraging?” (video explainer). (youtube.com)
[4] Ray Dalio, short-form clip on “beautiful deleveraging.” (youtube.com)
[5] Reuters coverage of CBO near-term deficit path (FY2024-2025). (reuters.com)
[6] Associated Press summary of CBO’s 10-year outlook (debt +$23.9T over decade; drivers). (apnews.com)
[7] Congressional Budget Office, The Long-Term Budget Outlook: 2025 to 2055—headline results: net interest 5.4% of GDP by 2055; outlays path. (cbo.gov)
[8] Peter G. Peterson Foundation, summary of the 2025 Long-Term Outlook: outlays to 26.6% of GDP; interest path and historical context. (pgpf.org)
[9] Committee for a Responsible Federal Budget (CRFB), analysis of CBO 2025 outlook: interest consumes ~28% of revenues by 2055; R > G later in the horizon. (crfb.org)
[10] Tax Project Institute, Ways Out of Debt: US Options for National Debt (June 14, 2025). (taxproject.org)
[11] Reuters recap of CBO long-term debt ratio (public debt ~156% of GDP by 2055). (reuters.com)
[12] CBO, Budget and Economic Outlook: 2025 to 2035 (context for near-term path). (cbo.gov)
[15] Cecchetti, S. G., Mohanty, M. S., & Zampolli, F. (2011). The Real Effects of Debt (BIS Working Paper No. 352). Bank for International Settlements.
[16] Eberhardt, M., & Presbitero, A. F. (2015). Public debt and growth: Heterogeneity and non-linearity. Journal of International Economics, 97(1), 45-58.
As we approach the United States’ 250th Semiquincentennial next year, a monumental shift in our nation’s economic strategy is underway. President Trump’s recent executive order to create a U.S. Sovereign Wealth Fund (SWF) marks a pivotal moment in American financial history[2][4]. At the Tax Project Institute, we have long discussed the potential benefits of a national investment account in the form of a SWF, recognizing its transformative potential for our economy (See our Article on Sovereign Wealth Funds here).
A Sovereign Wealth Fund is a state-owned investment fund that manages a country’s excess reserves, typically derived from natural resource revenues, trade surpluses, or other sources of national wealth. These funds are designed to invest in a diverse range of assets, both domestic and international, to generate returns and support long-term economic objectives. Much like a national investment account, it grows and compounds over time, and as it grows it becomes of source of revenue offsetting the need for things like additional taxes.
The creation of a U.S. SWF is a watershed moment that may be viewed by future generations as one of the most impactful acts in American history, comparable to the Louisiana Purchase, the Emancipation Proclamation, or the New Deal. Just like a savings and investment account, it doesn’t sound or look like much now, but in 50 or 100 years it could be game changing, and looked at in the same way as other major acts. While it won’t immediately solve our national debt issues or eliminate budget deficits, it could be the first step towards putting our country on a more substantial economic footing.
What are they for?
Sovereign Wealth Funds serve various purposes across the globe. Some of the key areas where SWFs are utilized include:
Economic Diversification: SWFs help countries reduce their dependence on a single sector or resource by investing in a wide range of industries and assets.
Intergenerational Savings: They can preserve wealth for future generations, especially in countries with finite natural resources.
Stabilization: SWFs can act as fiscal stabilizers during economic downturns or when commodity prices fluctuate.
Strategic Investments: They allow countries to invest in key industries or technologies that align with national interests.
Infrastructure Development: Many SWFs focus on funding critical infrastructure projects both domestically and internationally.
In short, they are investment accounts run by the country, and the hold the potential to fund significant portions of future expenses, and offset revenue short falls.
What it means for the U.S?
The U.S. SWF has the potential to become the largest in the world, given the size and strength of the American economy. As of 2025, the largest SWF is Norway’s Government Pension Fund Global, with assets under management of $1.78 trillion[6]. The U.S. fund could potentially surpass this figure, leveraging the country’s vast economic resources and global influence.
The implications of a U.S. Sovereign Wealth Fund are far-reaching:
Enhanced Global Economic Influence: A large U.S. SWF would significantly increase America’s economic clout on the world stage, potentially rivaling or surpassing the influence of other major SWFs from countries like China, Norway, and the UAE[6].
Domestic Investment: The fund could be used to finance critical infrastructure projects, support emerging industries, and drive innovation within the United States.
Long-term Fiscal Planning: A well-managed SWF could provide a cushion against economic downturns and help address long-term fiscal challenges.
Wealth Distribution: If structured appropriately, the fund could potentially provide direct benefits to American citizens, similar to Alaska’s Permanent Fund[4].
Strategic Acquisitions: The fund could be used to acquire stakes in strategically important companies or technologies, as hinted at by the potential involvement in TikTok[2][4].
Market Impact: The sheer size of a U.S. SWF could have significant effects on global financial markets, potentially influencing asset prices and investment trends
While not a panacea, a SWF offers significant Economic flexibility at scale to offset and provide services in a number of ways to minimize economic shocks, like the 2008 Great Recession or the COVID pandemic, or offset expenses on long term items like infrastructure, or potential pending large scale changes in the market, like AI offsetting white collar jobs.
Global Context
As we consider the potential of a U.S. Sovereign Wealth Fund, it’s important to look at some of the largest existing SWFs for context:
Country
Fund
Value
Norway
Norway Government Pension Fund Global
$1.78 Trillion
China
China Investment Corporation (CIC)
$1.3 Trillion
Abu Dhabi
Abu Dhabi Investment Authority
$1.05 Trillion
Kuwait
Kuwait Investment Authority
$1 Trillion
Saudi Arabia
Public Investment Fund
$925 Billion [6]
These funds have played crucial roles in their respective countries’ economic strategies, from Norway’s focus on preserving oil wealth for future generations to China’s efforts to diversify its foreign exchange reserves. Given that the US GDP is almost 13 times larger than Norway, you can see the potential size of the fund and the proceeds that it maybe able to throw off. Just doing simple math lets say the US SWF reaches $20 trillion, taking 4% annually from the fund to reinvest on Americans (offset taxes, new infrastructure, services, direct payments, etc.) could lead to $800 billion in annual offsets. Given the unending demands on government budget, this won’t solve our problems, but it can certainly help.
Summary
The creation of a U.S. Sovereign Wealth Fund represents a paradigm shift in how America approaches its economic future. As Treasury Secretary Scott Bessent explained, “It will include a mix of liquid assets and resources that we possess domestically as we aim to make them available for the American populace.”[4] This approach could unlock significant value from government assets and activities that have previously been underutilized.
However, the establishment of such a fund is not without challenges. Proper governance structures, transparency measures, and regulatory frameworks will be crucial to ensure the fund operates in the best interests of the American people. As a 2024 study by the Carnegie Endowment for International Peace warned, without appropriate safeguards, sovereign wealth funds could potentially become “vehicles for corruption, money laundering, and other illegal activities.”[4]
The development of the U.S. SWF over the next year will be a process closely watched by economists, policymakers, and global investors alike. Its potential to reshape America’s economic landscape and global financial influence cannot be overstated. As we celebrate our nation’s 250th anniversary, the creation of this fund may well be remembered as a defining moment in our economic history.
In conclusion, the establishment of a U.S. Sovereign Wealth Fund represents a bold step towards securing America’s economic future. By leveraging our nation’s vast resources and economic power, this fund has the potential to drive innovation, support critical investments, and ensure long-term fiscal stability. As we move forward, it will be essential to strike a balance between ambitious growth and responsible management, ensuring that this new economic tool truly serves the interests of all Americans for generations to come.
Imagine running your household. You earn money (income), spend on essentials (expenses), and sometimes need to borrow for bigger purchases (debt) that exceed your income or savings. The national debt is similar, but on a much larger scale, affecting the entire country. While it is not the same as the US has some other unique features that allow it to potentially borrow more, it acts in the same way.
What is it?
The National Debt is simply the total amount of money the US government owes. It accumulates whenever the government spends more than it collects in taxes and other revenue. It is like using a credit card – convenient in the short term, but the bill comes due eventually and like a credit card the Government must pay interest on the debt in the form of Interest payments, often referred to as Debt service.
Who manages it?
Several key players manage the National Debt:
The Treasury Department1: They issue debt instruments like Treasury bills, notes, and bonds, borrowing money from investors to raise money “credit” for the Government.
The Federal Reserve: They play a role in managing interest rates, which affect the cost of borrowing for the government. They set a key borrowing rate known as the Fed Funds rate at which other banks’ rates are set against. As interest rates rise, so does the expense of service the debt, much like credit card companies raising the interest rates for your credit.
Congress: They authorize the government to spend and borrow money, responsible for managing the debt. Congress holds the purse strings on spending by authorizing spending bills and setting the Debt limit with authorized Debt ceilings.
Who does what?
Several independent agencies track the National Debt:
Government Accountability Office (GAO): They audit the government’s financial statements and report on the debt.
Congressional Budget Office (CBO): They provide economic forecasts and analyze the impact of debt on the budget.
Bureau of the Fiscal Service: They manage the day-to-day operations of the national debt.
Executive (President of the United States): The President sets the Fiscal Policy, Priorities, and Plan for the budget.
Office of Management and Budget (OMB): They help prepare the President’s budget, manage the Execution once Congress has approved the budget, and manage the oversight and performance management of the budget.
How does it grow or shrink?
Debt grows when the government spends more than it takes in. This can happen through various scenarios:
Fiscal Policy: When the President’s Fiscal Policy spends (intentionally or unintentionally) more than the taxes and revenue collected.
Tax cuts: When taxes are lowered and not offset by the Economic growth from the tax cuts.
Increased spending: More money on programs like entitlements including Social Security and Medicare or discretionary items like national defense, infrastructure programs add to the debt.
Economic downturns: When the economy shrinks, tax revenue falls, and the government chooses to borrow to stimulate it instead of reducing spending.
Exogenous events: Events like the 2008 Financial Crisis, Wars, or the COVID Pandemic can lead to debt spending to address.
The debt shrinks when the government collects more revenue than it spends or through strategic debt payments. Many of these are possible but often not used as they can be politically risky.
Government Spending Cuts: The Government can reduce spending by cutting or reducing programs.
Increased Taxes: The Government can increase taxes, although the long-term effects are mixed potentially reducing long-term growth which also impacts taxes collected.
Economic Growth: While not shrinking the debt, as the Economy grows more taxes are collected. If expenses remain the same, growth will reduce the ratio of expenses to revenue, effectively shrinking the budget.
Where does it fit in with spending and policy?
Fiscal policy is set by the President and refers to how the government manages its spending and taxes. It is a balancing act: providing essential services while keeping the debt under control. Like household credit it must be balanced with the benefits of immediate spending versus the challenges of paying items back later knowing that for every dollar you put on credit you will be reducing your available money to spend because a portion of your income will now go to credit card fees.
“If you choose not to decide, you still have made a choice”
Freewill performed by Rush
Historical context
The National Debt started during the Revolutionary War to finance the fight for US Independence. Since then, it has fluctuated based on several factors like wars, economic recessions, and government priorities.
How is it authorized?
Congress authorizes the government to borrow money by passing legislation, setting limits on the amount of debt allowed, known as the Debt Ceiling. From time to time this limit must be authorized to expand the Debt Ceiling to enable more debt to pay government bills.
The Future?
The National Debt is a complex issue with no easy solutions. Balancing competing priorities, managing interest payments, and ensuring long-term economic stability are key challenges. While there is no magic bullet, responsible fiscal policy, public understanding, and informed debate are crucial for navigating the complexities of the National Debt. The debt burden and interest on the National Debt are very real and left unmanaged can lead to negative consequences to the Economy and our Country.
The US Economy, measured by its Gross Domestic Product (GDP), represents the total value of all goods and services produced within a year. However, looming over this economic output is the ever-growing shadow of National Debt, raising concerns about sustainability and future generations. This article delves into the comparison between these two figures, explores how recent events impacted them, and examines the challenges posed by a large National Debt exceeding the size of the US Economy.
The National Debt of the United States has been steadily climbing, driven by several factors including fiscal policy, increased spending, and economic downturns. The COVID pandemic significantly accelerated this trend, adding over $7 trillion to the debt, while the roots run deeper. The Great Recession of 2008 also played a major role, pushing the debt-to-GDP ratio above 60% for the first time since World War II. As of Valentines Day 2024, the US National Debt stands at a staggering $34.3 trillion, that’s 34 x 10(12), exceeding 125% of the country’s GDP1.
Inflationary Dance with Debt
This high debt burden intersects with another economic concern: inflation. Increased spending and money supply expansion are often cited as contributing factors to inflation. In 2023, the US experienced inflation rates not seen in decades, exceeding 9% at one point2. While complex and multifaceted, the correlation between debt, money supply, and inflation cannot be ignored3. As Warren Buffett famously said, “Only when the tide goes out do you discover who’s been swimming naked.” Growth in money supply does not automatically mean inflation, but if it outpaces productivity, inflation often follows.
“Only when the tide goes out do you discover who’s been swimming naked.” 4
Warren Buffet
Sustainability Concerns and Interest Bite
Beyond inflation, a ballooning debt raises concerns about its long-term impact. Servicing the debt consumes an increasingly larger portion of the federal budget, diverting resources from crucial areas. The interest on our debt in 2023 reached $659 billion dollars4, to put that in perspective there are less than 40 countries in the World whose entire economy is greater than the interest alone we are paying on our debt5. As interest rates rise, often seen during periods when the Federal Reserve is combatting inflation, interest payments balloon exacerbating the challenge of pay down the debt. Additionally, a high debt can weaken investor confidence, potentially leading to higher borrowing costs and hampering economic growth6.7
“I have yet to see a time when it made sense to bet against America. And I doubt very much that any reader of this letter will have a different experience in the future.”
Warren Buffett
Balancing Act and Looking Ahead
Managing the national debt requires a delicate balancing act. Reducing spending can be politically unpopular, and raising taxes carries economic risks. Meanwhile, relying solely on economic growth for debt reduction is an uncertain strategy. Finding a sustainable path forward necessitates responsible fiscal policy (spending within our means) and bipartisan cooperation, both of which remain elusive in the current political climate.
However, as Warren Buffett has bullishly stated: “I have yet to see a time when it made sense to bet against America. And I doubt very much that any reader of this letter will have a different experience in the future.”
While expressing confidence in the long-term potential of the US economy, acknowledging the need for responsible debt management remains crucial.
Now, I’m not one for religiously monitoring my sodium intake, but something about the neat rows of percentages and bolded numbers held an unexpected allure. It listed everything: calories, fat, carbs, even the amount of vitamin A lurking within those tiny alphabet shapes. It was clear, concise, and, dare I say, informative.
Standing in the fluorescent purgatory of the grocery aisle, I scanned the endless rows of canned soup. My hand hovered over a familiar red and white label, the promise of “Tomato A to Z’s” tugging at my youth. But then, my gaze snagged on something else entirely: the nutrition label.
The Awakening
I had an epiphany at that moment, and it struck me as very strange. Here I was, gleaning more readily available information about the microscopic breakdown of my potential lunch than I had ever received about where my tax dollars were going. It was a sobering realization.
Just last year, I meticulously researched every nook and cranny of a new car before signing on the dotted line. Hours were spent comparing models, features, reading reviews, negotiating the price. Buying a house? Months of inspections, paperwork, researching neighborhoods, hours with the realtor visiting open houses, and financial planning went into that decision. Yet, taxes, a cornerstone of my financial well-being and likely the third biggest expense after housing and a car for many, remained shrouded in mystery.
The label mocked me with its transparency. Did the government offer a similar breakdown of where my hard-earned money went? Did they list out the exact percentage going towards infrastructure, healthcare, or education, like the label helpfully categorized fat and carbs? Everything you buy or spend money on you get a receipt, a check, a bank statement but I already knew the answer was a resounding no.
I was curious, this wasn’t just about soup anymore. It was about the dissonance between the effort we put into everyday decisions and the near apathy towards something as impactful as taxes. We readily dissect the ingredients of our food, scrutinize the features of our gadgets, yet blindly accept a system that affects every aspect of our lives without demanding the same level of understanding.
Suddenly, the alphabet noodles seemed symbolic. A jumble of seemingly meaningless shapes, much like the acronyms and financial jargon that littered tax documents. We were expected to navigate this labyrinth without a clear picture of the bigger picture, the impact, the outcome. There was no clear path as a citizen to see where your tax dollars went except into some giant Black Hole.
Expect More
But what if we demanded more? What if we treated our tax dollars like carefully chosen ingredients, seeking transparency and understanding before blindly accepting the pre-made soup? That thought was the genesis of the Tax Project Institute.
Maybe the answer wasn’t in ditching the alphabet noodles, but in demanding more transparency for our taxes and informative labels. A label that listed the schools our taxes built, the roads they paved, the research they funded. A label that empowered us to be informed participants, not passive bystanders, in the decisions that shaped our lives and those of our successors.
Perhaps, with enough collective curiosity and a dash of critical thinking, we could turn the opaque world of taxes into something as clear and informative as a well-labeled can of soup. And that, my friends, would be a recipe for real change.
If you feel like transparency is more important, join us. Donate or Volunteer today.
Tax Project Institute is a fiscally sponsored project of MarinLink, a California non-profit corporation exempt from federal tax under section 501(c)(3) of the Internal Revenue Service #20-0879422.