Apr 15, 2025
In recent years, the idea that the current generation of Americans face a worse economic outlook than their parents has taken root in national discourse. Stagnant wages, rising student debt, unaffordable housing, and pessimism about the American Dream dominate headlines and social media. A 2022 Gallup poll revealed that only 42% of Americans believe today’s youth will have a better life than their parents—down from 71% in 1999 (5). Yet, deeper research shows the reality is more nuanced, with significant differences within generational outcomes and opportunities (2),(3),(5).
These perceptions, though, stem from real challenges that reflect deeper systemic issues—including a lack of public understanding about how macro trends creating these conditions and how our government works plays into the impact. Government Financial Literacy—when citizens understand how public money is raised, spent, and used —it is an essential foundation for a better future for America. Without it, Americans risk making decisions that prioritize short-term comforts over long-term sustainability, effectively robbing future generations of the stability and the quality of life that prior generations of Americans experienced while continuing to build upon for future generations.
Generational Comparisons
While it’s true that some younger Americans are doing better than their parents, the broader picture is far from reassuring. A Federal Reserve survey found millennials and Gen Z adults were nearly as likely as baby boomers to report being financially better off than their parents at the same age (5). However, this is largely concentrated among those following traditional middle-class trajectories: stable jobs, college degrees, and homeownership. A Cambridge University study found these individuals have accumulated substantially more wealth than Baby Boomers at similar life stages (6).
Unfortunately, this success is not universal. For many millennials stuck in low-wage service jobs or unable to afford independent living, the situation is worse than it was for comparable Baby Boomers (4). The wealth gap has widened significantly within generations. What we’re experiencing isn’t simply generational decline—it’s rising economic stratification (4),(6). And while some data show signs that the decline in intergenerational progress has slowed (5), ensuring all Americans can get ahead remains a central concern.
This phenomenon is not unique to the U.S. Globally, a median of 57% of people believe that today’s children will be financially worse off than their parents (3). That kind of pessimism reflects a common thread: people sense that structural systems are misaligned with future success (7).
The Growing National Debt: A Threat to Future Prosperity
One of the more concerning yet misunderstood threats to the next generation is the ballooning National Debt. As of 2024, the U.S. national debt has surpassed $36 trillion (9). To put that in perspective, the government now spends over $1.2 trillion annually just on interest payments—more than it spends on education or national defense (9).
The National Debt has increased over $10 trillion in the last 5 years alone, this trajectory is unsustainable (9). These interest payments are not investments in roads, schools, or healthcare—they’re payments to past lenders and serve no productive use to the people or the economy. If left unaddressed, these costs will continue to crowd out essential public services and squeeze future budgets (9).
Even more alarming is the fact that the U.S. has run budget deficits every single year since 2001. That’s more than two decades of spending more than we take in (9). For too long, policymakers have kicked the can down the road. But there’s a limit. Without intervention, interest on the debt could consume nearly 30% of all federal revenue within a generation (9).
Government Financial Literacy Matters
When does Government Financial Literacy become critical for our nation? Most Americans understand the importance of managing personal finances—budgeting, avoiding debt without commensurate returns, and saving for retirement. But relatively few apply the same logic to their expectations of government.
Many voters are unaware of how much the U.S. spends, what the largest programs are, how tax revenue is distributed, and how all of that impacts you and the health of our nation and its impact on America’s future, if they care at all. For instance, surveys repeatedly show Americans overestimate foreign aid spending by up to 25 times its actual amount, while underestimating the size of programs like Medicare and Social Security (10).
This misinformation leads to distorted public debate and ineffective policymaking. A financially literate electorate would understand that:
- Most federal spending goes to mandatory programs (e.g., Social Security, Medicare, interest on the National Debt) (9)
- Only a small portion of the budget is discretionary, and even smaller for things like infrastructure or education (9)
- Spending increases should balance budgets with cuts or revenue and must be evaluated together, not in isolation (9)
In short, better public understanding could drive smarter priorities and realistic expectations.
Direct Impacts on Everyday Americans
You don’t need to be an economist to feel the effects of unsustainable government finance. Consider:
- Less Bang for your Tax Dollar: When interest rates rise, the government pays more to borrow—which means fewer funds are available for services like health care, education, social services, etc. (9).
- Inflation: Deficits and mounting debt can lead to inflationary pressure, eroding the value of the dollar impacting savings and raising the cost of living (9).
- Opportunity: Programs essential to economic mobility—public education, transportation, broadband access—are increasingly underfunded or delayed, reducing opportunity (9).
These outcomes shape the daily reality of Americans. A nation’s budget is a reflection of its priorities. If we continue to borrow to fund consumption today, we are effectively asking our children to pay for it tomorrow—often with interest (9).
Knowledge will forever govern ignorance; and a people who mean to be their own governors must arm themselves with the power which knowledge gives.
James Madison
Tough Decisions and Shared Sacrifice
Improving America’s fiscal future doesn’t mean abandoning government support or social progress. However, it does require making tough decisions.
Sometimes, that means saying no to popular but expensive programs that lack sustainable funding. Sometimes it means accepting modest tax increases to secure long-term benefits like universal preschool or paid family leave. Sometimes it means delaying gratification for the good of future generations.
For a country founded on ideals of independence, self-governance, civic responsibility, and long-term investment in the public good, these decisions should not be unprecedented. However, with each passing generation of increased prosperity, we may have lost that connection due to the tough decisions, or lack there of, of the past. These decisions require an electorate that understands tradeoffs, accepts hardships, values sustainability, and is willing to act not just for today’s comfort, but for tomorrow’s opportunity. Even harder, sacrificing a little of their prosperity so that future Americans can enjoy theirs too.
Government Financial Literacy helps citizens:
- Ask better questions (10)
- Discern between realistic policies and political gimmicks (10)
- Engage in constructive civil discourse (10)
- Support leaders who prioritize stewardship over short-term wins (10)
- Make more informed fact based decisions (10)
Building a Better Future
Organizations like the Tax Project Institute are working to help inform citizens and build that understanding, offering nonpartisan, accessible insights into how public finance works—and how it affects all of us. Our mission centers around transparency, accountability, and education: helping citizens become informed stewards of our future (10).
By informing the public to understand not only what government spends—but how, why, and what the consequences are—we can alter the trend of pessimism and help restore faith in the American Dream(10).
Our children’s future depends not just on innovation or entrepreneurship, but on collective civic duty to promote a properous future for all Americans. If we cannot manage our shared resources responsibly, we undermine the very foundation of opportunity we hope to pass on (9),(10).
Conclusion: Ignorance and Knowledge each have a Cost
America’s challenges are not insurmountable. However, they require a shift in how we engage with public life. We cannot rely solely on elected officials or experts to protect the future—citizens must be informed participants in the democratic process (10).
The national debt is growing at an unsustainable rate. The federal government has run deficits for over two decades. And interest on that debt threatens to consume nearly everything else. Meanwhile, Americans continue to underestimate the impact of their own votes, their own voices, and how these have real consequences to current and future Americans (9),(10).
The answer is not always “more government”—especially when that means borrowing more or spending on poor investments. It’s, also, not always “less government,” either. The answer is smarter government choices, guided by citizens who understand how the system works and what’s at stake (9),(10).
Government Financial Literacy is a Civic Duty and responsibility of each citizen in a Democracy, not something we can trust to a few elected officials, it’s a necessity. For the sake of our children, our communities, and our future as a free and prosperous nation, it’s time we all learned how the budget works—and how to make it work better (10).
Sources
- NASDAQ https://www.nasdaq.com/articles/generations-feel-financially-worse-their-parents
- Lending Tree https://www.lendingtree.com/debt-consolidation/millennials-financial-condition-study/
- Pew Research https://www.pewresearch.org/global/2025/01/09/views-of-childrens-financial-future/
- Phy.org by University of Cambridge https://phys.org/news/2023-11-millennials-worse-baby-boomers-rich-poor.html
- American Enterprise Institute https://www.aei.org/articles/has-income-growth-between-generations-of-americans-stalled/
- Cambridge University https://www.cam.ac.uk/research/news/boom-and-bust-millennials-arent-all-worse-off-than-baby-boomers-but-the-rich-poor-gap-is-widening
- Pew Research https://www.pewresearch.org/global/2025/01/09/economic-inequality-seen-as-major-challenge-around-the-world/
- CNBC https://www.cnbc.com/2024/04/03/survey-adults-say-theyre-doing-worse-financially-than-their-parents.html
- Congressional Budget Office https://www.cbo.gov/publication/60127
- Tax Foundation https://taxfoundation.org/americans-understanding-of-taxes-2023/
Dec 1, 2024
We’re thrilled to introduce the Tax Project’s Debt Clock, a dynamic tool designed to bring U.S. government finances into clear focus. This real-time tracker displays the real time National Debt, current budget surplus/deficit, and the growing interest on debt all up to date. Numbers alone can be abstract, so the Debt Clock takes it further: it contextualizes $36 trillion of debt in relatable terms, such as what it could fund instead—education, poverty, green goals, etc. It also visualizes and puts the debt into scale to help you understand the scope, and shows them in debt per citizen, tax payer, percentage of GDP, and how it compares the the entire Economy of the largest countries helping users grasp the scale and implications of this staggering figure.
Through interactive features, the Debt Clock offers a tangible perspective on government spending, fostering informed conversations about fiscal responsibility. As a tool for education and engagement, it aligns with our mission to promote transparency, accountability, and understanding of public finances. Dive in and explore how numbers shape our shared future. Check it our here, register for free!
Debt Clock
Real time Debt Clock, Historical Federal Budget Surplus and Deficit, and Debt Scale
Nov 6, 2024
Now that the election is over and Donald Trump has been elected to return to the White House, the new administration is poised to name Elon Musk as the head of a newly formed Government agency: Department of Government Efficiency (DoGE). While this appointment may be viewed as either a refreshing change, or terrifying thought, at the Tax Project Institute we want to stick to our nonpartisan values and discuss what those changes might mean.
If, as expected, Elon Musk is appointed to head this agency it seems reasonable to assume he will bring new and potentially dramatically different approaches to Government spending and is likely to streamline government operations and slash federal spending as he has done with other organizations like Twitter. While other Government efficiency efforts have been done before, these ambitious goals include cutting the federal budget as stated by $2 trillion could and will dramatically reshape the scope and scale of Government, and potentially the services provided, as well as the impact of Government on the Economics of our country. This bold fiscal policy aims to address the nation’s spiraling deficit and ballooning national debt, while simultaneously promoting a more transparent, data-driven government will have deep and lasting impacts on our country if enacted.
Musk’s reputation for innovation and unconventional thinking is expected to drive a focus on technology and efficiency across federal agencies, potentially paving the way for significant cost reductions. However, achieving these cuts while maintaining essential services raises complex challenges, especially as the government confronts rising interest payments on the national debt and an ongoing annual deficit exceeding $1 trillion. This article delves into the prospects and concerns surrounding this new administration’s fiscal direction, particularly in the context of transparency and public accountability, alongside a list of aspirations that citizens have for a more open government.
Prospects and Challenges for a $2 Trillion Budget Reduction
The goal of reducing federal spending by $2 trillion is both promising and fraught with potential challenges. Given that the US Federal Government Revenue was $4.5 trillion1, the act of removing $2 trillion (more than 44%) would be a significant undertaking. As likely the most ambitious target proposed by any administration, this cut has far-reaching implications, particularly in relation to deficit reduction and debt management. Below are several anticipated effects, both positive and challenging, of enacting such a substantial fiscal policy.
1. Progress in Deficit and Debt Reduction: With the national debt surpassing $35 trillion and continuing to grow, and annual budget deficits more than $1 trillion, a $2 trillion reduction in Government spending could provide a substantial offset to the deficit, potentially balancing the budget over time with fiscal discipline. If successful, this could also ease the government’s debt burden, reducing the need for borrowing and interest payments that account for a growing share of federal expenditures. As we reduce our National Debt and Interest on Debt, that could free the country to increase spending on higher priority items of need.
2. Risk to Essential Public Services: Federal spending cuts of this magnitude are bound to affect a range of public services. Mandatory spending programs, such as Social Security, Medicare, and Medicaid, currently consume a large portion of the budget, leaving discretionary spending—including defense, education, and infrastructure—at risk of major reductions. The challenge for the new administration and the DoGE will be to identify areas for efficient cost-cutting without diminishing critical services. Roughly two thirds of the Federal Budget are considered Entitlements and are legally mandated by law. So, both Fiscal AND Legislative changes are likely required to achieve significant cuts, or major changes in Entitlement programs which will have to be addressed if cuts are expected to approach anything near $2 trillion. These could take the form in Social Security updates like changes to retirement eligibility, increases in contributions, or reductions in benefits. It may also include items to put them on better fiscal paths like having Social Security funds invest in capital markets versus Treasuries for higher and more sustainable returns. It could also include the creation of a Sovereign Wealth Fund.
3. Economic Ripple Effects: Federal spending creates demand and economic activity, particularly in times of downturns, by providing funding to numerous sectors. If the Government was making wise investments with good future returns for the Economy, then reducing the budget will slow contributions to GDP, with potential implications for employment and economic stability in areas reliant on federal contracts and support. While it is unlikely that significant portions of Government investments have positive ROI, there of course will be some. A careful balance is needed to avoid inadvertently disrupting the economy, especially in critical industries such as defense, education, and healthcare.
4. Interest Payments on the National Debt: The U.S. government currently spends a significant portion of its budget on interest payments for the national debt (basically the national credit card fees). Reducing the deficit and limiting further debt accumulation could help stabilize and over time reduce these interest obligations, freeing up funds for other initiatives. However, such an outcome hinges on the administration’s ability to sustain spending cuts without compromising economic performance or resorting to additional borrowing. The interest alone on our National Debt exceeded $1 trillion dollars2 this year, surpassing the US Military budget as the 3rd largest item on the Federal Budget. (See our Debt Clock to see what we could buy instead)
Hopes for Greater Transparency and Accountability
Beyond fiscal reform, the public’s expectation for transparency remains high. With Musk overseeing government efficiency initiatives it appears likely he will use a technology-driven approach to transparency that hopefully enhances public access to information. These priorities reflect a collective desire by Americans for an open government that promotes citizen engagement and holds itself accountable. Key areas of focus include:
1. Open and Accessible Government Data: Making government data more accessible is central to fostering public trust and enabling citizen oversight. This includes ensuring that data on federal spending, program effectiveness, and agency performance are freely available and easy to navigate. Providing open data also enables journalists, researchers, and citizens to independently monitor government actions, thereby enhancing accountability.
2. Reliable and Authoritative Data Sources: To improve the quality of publicly available information, there should be a single, authoritative source for government data, similar to how agencies like the Office of Management and Budget (OMB) and the Congressional Budget Office (CBO) provide budget and financial reports. Centralizing these data sources would improve consistency and reliability, helping the public make more informed assessments of government initiatives. There should not be a dozen budget values for the same data on a dozen government websites. Citizens should not have to navigate this maze and determine what is real.
3. Real-Time and Updated Data Access: Providing timely access to government data could allow for better tracking of government operations. Currently, data lags and gaps sometimes prevent the public from seeing an accurate picture of federal spending and performance. Real-time data availability would facilitate more immediate oversight, enabling citizens and watchdogs to identify trends and inefficiencies as they happen when agencies and officials can be held accountable. Negligence, Omission, Ignorance, or Incompetence should not shield those accountable for performing for the American citizen.
4. Centralized and Standardized Government Systems: One of the challenges in promoting transparency is the fragmentation of data across multiple departments and agencies each having their own separate systems and practices. A centralized system for government data, with standardized formats and reporting practices, would streamline access and reduce the burden of sifting through disparate data sources and simplify Government accounting and hopefully lead to increased efficiency.
5. Promoting an API Economy: Enabling API (Application Programming Interface) access to government data would encourage the development of tools, dashboards, and other applications that present this information in user-friendly formats. An API economy would allow developers to build tools for the public to access and analyze government data in new ways, expanding transparency efforts and driving innovation in how the public interacts with government information.
6. Reporting Transparency: Having the Government produce similar annual and quarterly reporting like that used for public corporations would greatly benefit transparency. In the private sector, public companies are required to file statements of financial health and transparency annually and quarterly. These 10K and 10Q statements are standardized and easily comparable between companies and provide a historical view that can be used to make assessments of past and future performance. Similarly, if the government provided a similar 10K/10Q reporting would be a major step forward in transparency. Some groups like USAFacts.org have attempted to produce a government 10K but an official 10K that would require an audited financial statement and officer signoff would be a major step forward in transparency and accountability.
The Department of Government Efficiency: Elon Musk’s Role
The creation of the DoGE, with Musk at its helm, would symbolize the new administration’s drive to bring private-sector efficiency to federal operations. Given Musk’s track record of disruptive innovation at companies like Tesla and SpaceX, his appointment may signal a move toward leveraging technology, automation, and streamlined processes to minimize waste and maximize productivity within government agencies. Below are some potential avenues Musk might explore to achieve these goals.
1. Technological Innovation for Cost Reduction: Musk’s experience with automation and artificial intelligence (AI) could translate into technological upgrades for government operations. Automation could reduce administrative costs, freeing up resources for other priorities, while AI could be used to analyze data and streamline decision-making processes. However, implementing such changes on a government-wide scale would require balancing efficiency with service quality.
2. Cultivating Private-Sector Accountability Standards: The private sector often enforces accountability and cost-efficiency as core values, and Musk’s leadership could promote a similar culture within federal agencies. This could lead to a reduction in wasteful spending and a renewed focus on delivering measurable results. However, government operations differ significantly from private enterprises, and accountability standards must consider the unique public-service mission of government work.
3. Balancing Efficiency with Public Needs: While the private sector emphasizes efficiency, the government must provide essential services and maintain levels of service in many areas where a private company would not be economically feasible, or large capital projects only possible with state level funding. As Musk’s DoGE explores ways to reduce costs, it will need to ensure that essential services remain accessible to all citizens. This balancing act may require adjustments to private-sector principles to fit the public-interest framework of government services, and a dialogue between the public and private sector on what services and quality levels are acceptable. Defining Government Services, Service Levels, and Scope for each Government agency would go along way at standardizing services to the public. There is likely to be widescale disagreements finding the balance.
A Path Toward Fiscal Responsibility and Public Trust
With the incoming administration’s ambitious goals for a government that is financially responsible, innovative, and accountable many are hoping that they play equal weight on balancing against the negative consequences if done poorly. The proposed $2 trillion budget cut, while fraught with challenges, represents a meaningful step toward addressing the national debt and reducing the deficit.
Yet, achieving these savings will require a delicate balance, as well as the guidance of a government that prioritizes public needs alongside fiscal restraint. As the new administration takes office, the public’s hope for openness, innovation, accountability, and balance against negative impacts remain high. These aspirations reflect a broader desire for a government that is both efficient and responsive to the needs of its citizens, paving the way for a future
Citations
- US Treasury https://fiscal.treasury.gov/files/reports-statements/financial-report/2023/executive-summary-2023.pdf
- Federal Reserve https://fred.stlouisfed.org/series/A091RC1Q027SBEA
Feb 23, 2024
How to read the Official Government Debt Website
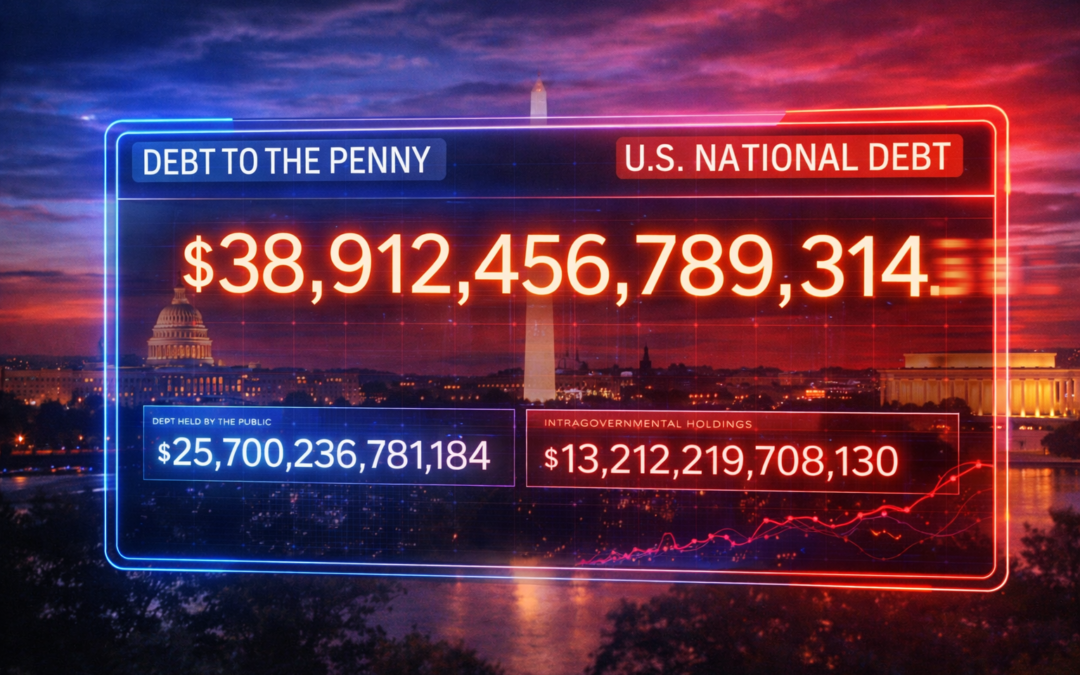
There are many Debt Clocks, but if you want the official U.S. government number for the US National Debt, the US Treasury’s Debt to the Penny website is one of the most useful places to start. It is a Treasury dataset that reports the total outstanding public debt each business day and breaks that total into its main components. For readers trying to understand how much the United States owes, how that figure is structured, and how fast it changes, it is the main public source. [1][2]
At a basic level, Debt to the Penny answers a simple question: how much debt does the US Federal government have outstanding right now? But what makes it useful is that it does not stop at one giant headline number. Treasury shows the total public debt outstanding and separates it into debt held by the public and intragovernmental holdings. That matters because the top-line debt number is real, but the parts inside it are not all the same thing economically. [1]
Debt to Penny Components
Debt Held by the Public: The first major component is debt held by the public. Treasury defines this as Federal debt held by entities outside the U.S. government, including individuals, corporations, state and local governments, Federal Reserve Banks, foreign governments, and other outside holders. This is the portion of the debt most people usually have in mind when they think about the government borrowing from investors and paying interest to outside creditors. [1]
Intragovernmental Holdings: The second major component is intragovernmental holdings. These are Treasury securities held by government trust funds and other federal accounts. In other words, one part of government is holding debt issued by another part of government. Treasury includes Government Account Series securities in this category, along with Federal Financing Bank securities. [1]
Total Public Debt Outstanding: Add those two together and you get total public debt outstanding, which is the main headline figure on Debt to the Penny. Treasury also notes that this total includes a range of Treasury instruments, including bills, notes, bonds, Treasury Inflation-Protected Securities, floating rate notes, savings securities, State and Local Government Series securities, and other government-related debt instruments. [1]
One source of confusion is terminology. People often say “National debt,” “Federal debt,” or “Public debt” as if they are interchangeable. Treasury itself uses “National Debt” on its public explainer page, while the dataset label is “total public debt outstanding.” For ordinary readers, those are often referring to the same top-line federal debt figure, but it is still useful to know that the dataset has a formal label and that it also separately reports debt held by the public. [1][2]
Debt to the Penny is useful because it is updated frequently. Treasury says the dataset is released daily and updated at the end of each business day using the prior business day’s data. The current series on the dataset page runs from April 1, 1993 through March 19, 2026, with new data expected on the next business day. That means readers can do more than look at a one-time figure. They can track movement over time and see how the debt changes from day to day. [1]
That daily movement is not trivial. At the scale of the US Government, the debt often changes by billions of dollars daily as the government borrows, redeems maturing obligations, rolls over securities, collects revenue, and makes payments. Debt to the Penny is therefore not just a static scoreboard. It is a running measure of a large and active federal balance sheet. Treasury’s broader national debt explainer also notes that the debt has increased every year over the past ten years and points to major drivers such as wars, recessions, and the COVID-19 period. [2] (Treasury’s National Debt Explainer)
Debt Clock Tools
For readers who want the cleanest official answer, Debt to the Penny is the right place to look. However, it is not designed first as a public education tool. It is a Treasury dataset. That means it is authoritative, but it can feel dry if you are trying to grasp scale, pace, and context rather than just pull a number. It basically looks like a set of numbers that you need to interpret. [1][2]
That is where the Tax Project’s Public Debt Clock is useful as an alternative and complement. Tax Project describes its clock as a real-time tracker that shows the national debt, the current budget surplus or deficit, and the interest on the debt. It also adds context by showing debt per citizen, debt per taxpayer, debt as a share of GDP, and comparative scale measures intended to make the number easier to understand and how it relates to you personally. The clock is a way to explore America’s National Debt in real time and see the scope and scale of what America owes. [3][4] (Tax Project Institute Debt Clock)
That distinction matters. Treasury’s Debt to the Penny is the official source. Tax Project’s Public Debt Clock is the more interpretive public-facing tool. One is best for the base data. The other is better for readers who want a faster visual sense of magnitude, related measures, and a more interactive experience. Tax Project’s earlier explainer on debt clocks also notes that these clocks typically use Treasury debt data and simulate movement between reporting cycles so users can see a live estimate rather than wait for the next official update. For example the Debt to the Penny updates daily, but the daily amount changes by billions each day. The Tax Project Debt Clock interpolates based on prior debt to the penny rates of change and use that to calculate a real time estimate. Since the Debt to the Penny generally goes up daily, the value you will see on the Tax Project Debt Clock will most likely be higher as it estimates the daily changes. [1][3][5]
The larger lesson is straightforward. America’s debt is not just a giant number to cite in a headline. It has structure. It has components. It changes constantly. And the public can now see it directly. If you want the official daily debt data, start with Treasury’s Debt to the Penny. If you want more context, more visualization, and more features, the Tax Project Public Debt Clock is a strong companion tool. [1][3][4]
References
[1] U.S. Department of the Treasury, Fiscal Data. Debt to the Penny.
[2] U.S. Department of the Treasury, Fiscal Data. Understanding the National Debt.
[3] Tax Project Institute. Tax Project Debt Clock Launch!
[4] Tax Project Institute. Tools - National Debt Clock.
[5] Tax Project Institute. The Debt Clock.
Feb 17, 2024
Imagine running your household. You earn money (income), spend on essentials (expenses), and sometimes need to borrow for bigger purchases (debt) that exceed your income or savings. The national debt is similar, but on a much larger scale, affecting the entire country. While it is not the same as the US has some other unique features that allow it to potentially borrow more, it acts in the same way.
What is it?
The National Debt is simply the total amount of money the US government owes. It accumulates whenever the government spends more than it collects in taxes and other revenue. It is like using a credit card – convenient in the short term, but the bill comes due eventually and like a credit card the Government must pay interest on the debt in the form of Interest payments, often referred to as Debt service.
Who manages it?
Several key players manage the National Debt:
- The Treasury Department1: They issue debt instruments like Treasury bills, notes, and bonds, borrowing money from investors to raise money “credit” for the Government.
- The Federal Reserve: They play a role in managing interest rates, which affect the cost of borrowing for the government. They set a key borrowing rate known as the Fed Funds rate at which other banks’ rates are set against. As interest rates rise, so does the expense of service the debt, much like credit card companies raising the interest rates for your credit.
- Congress: They authorize the government to spend and borrow money, responsible for managing the debt. Congress holds the purse strings on spending by authorizing spending bills and setting the Debt limit with authorized Debt ceilings.
Who does what?
Several independent agencies track the National Debt:
- Government Accountability Office (GAO): They audit the government’s financial statements and report on the debt.
- Congressional Budget Office (CBO): They provide economic forecasts and analyze the impact of debt on the budget.
- Bureau of the Fiscal Service: They manage the day-to-day operations of the national debt.
- Executive (President of the United States): The President sets the Fiscal Policy, Priorities, and Plan for the budget.
- Office of Management and Budget (OMB): They help prepare the President’s budget, manage the Execution once Congress has approved the budget, and manage the oversight and performance management of the budget.
How does it grow or shrink?
Debt grows when the government spends more than it takes in. This can happen through various scenarios:
- Fiscal Policy: When the President’s Fiscal Policy spends (intentionally or unintentionally) more than the taxes and revenue collected.
- Tax cuts: When taxes are lowered and not offset by the Economic growth from the tax cuts.
- Increased spending: More money on programs like entitlements including Social Security and Medicare or discretionary items like national defense, infrastructure programs add to the debt.
- Economic downturns: When the economy shrinks, tax revenue falls, and the government chooses to borrow to stimulate it instead of reducing spending.
- Exogenous events: Events like the 2008 Financial Crisis, Wars, or the COVID Pandemic can lead to debt spending to address.
The debt shrinks when the government collects more revenue than it spends or through strategic debt payments. Many of these are possible but often not used as they can be politically risky.
- Government Spending Cuts: The Government can reduce spending by cutting or reducing programs.
- Increased Taxes: The Government can increase taxes, although the long-term effects are mixed potentially reducing long-term growth which also impacts taxes collected.
- Economic Growth: While not shrinking the debt, as the Economy grows more taxes are collected. If expenses remain the same, growth will reduce the ratio of expenses to revenue, effectively shrinking the budget.
Where does it fit in with spending and policy?
Fiscal policy is set by the President and refers to how the government manages its spending and taxes. It is a balancing act: providing essential services while keeping the debt under control. Like household credit it must be balanced with the benefits of immediate spending versus the challenges of paying items back later knowing that for every dollar you put on credit you will be reducing your available money to spend because a portion of your income will now go to credit card fees.
“If you choose not to decide, you still have made a choice”
Freewill performed by Rush
Historical context
The National Debt started during the Revolutionary War to finance the fight for US Independence. Since then, it has fluctuated based on several factors like wars, economic recessions, and government priorities.
How is it authorized?
Congress authorizes the government to borrow money by passing legislation, setting limits on the amount of debt allowed, known as the Debt Ceiling. From time to time this limit must be authorized to expand the Debt Ceiling to enable more debt to pay government bills.
The Future?
The National Debt is a complex issue with no easy solutions. Balancing competing priorities, managing interest payments, and ensuring long-term economic stability are key challenges. While there is no magic bullet, responsible fiscal policy, public understanding, and informed debate are crucial for navigating the complexities of the National Debt. The debt burden and interest on the National Debt are very real and left unmanaged can lead to negative consequences to the Economy and our Country.