Confused about the National Debt, why you hear so many different numbers, and what they mean. Here’s a plain English explainer to help you make sense of it all. The National Debt is the total amount the U.S. Federal government owes to its creditors. It does NOT include the Debt held by State and Local Governments. Think of the National Debt as the running total of past annual deficits (when the government spends more than it collects in taxes and other income) minus any surpluses (when it collects more than it spends). The debt grows when there’s a deficit and shrinks—at least relatively—when there’s a surplus or when growth/inflation outpace new borrowing. [1][5]
Terms you should know:
DEFICIT: A deficit is a one-year budget shortfall (this year’s shortfall, which can occur every fiscal year).
NATIONAL DEBT: The debt is a accumulated total of all Deficits minus any Surpluses (the total outstanding IOUs accumulated over time).
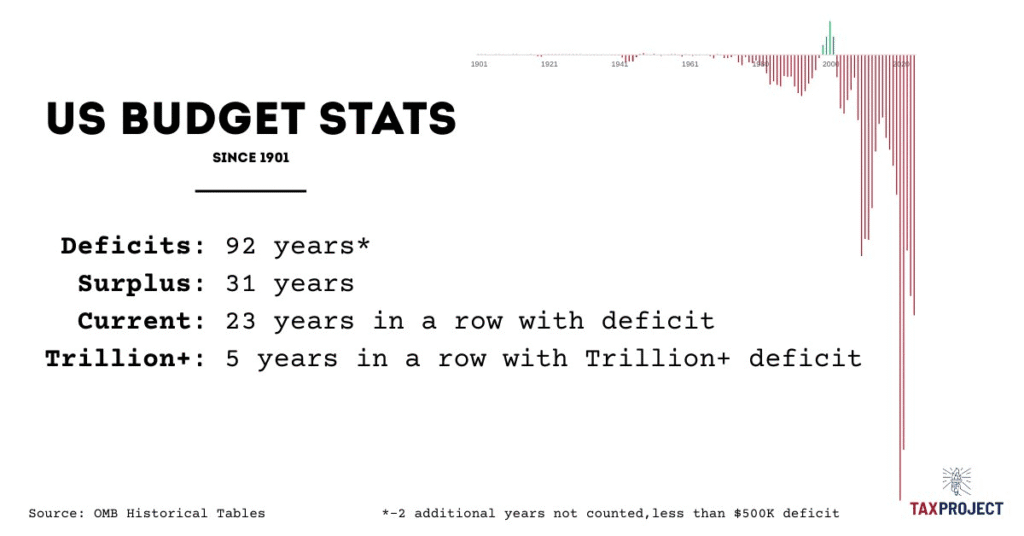
Figure 1 Historical Federal Budget Deficits and Surpluses Source: OMB
The U.S. Treasury’s Debt to the Penny website publishes the official daily total and its two big parts (explained below). You can look up yesterday’s number, last month’s, or data back to 1993. [2]
When people talk about the “National Debt,” they often mean one of three closely related figures:
Debt held by the public This is U.S. Treasury securities (Bills, Notes, Bonds, TIPS, etc.) held outside federal government accounts—by households, businesses, pension funds, mutual funds, state and local governments, foreign investors, and the Federal Reserve (America’s central bank). It’s the broadest “market” concept and is the figure economists often use when comparing debt to the size of the economy (debt-to-GDP). [3][4]
Treasury defines it as “all federal debt held by individuals, corporations, state or local governments, Federal Reserve Banks, foreign governments, and other entities outside the United States Government.” [3]
Intragovernmental holdings These are Treasuries held within the federal government – mainly trust funds such as Social Security and Medicare. When these programs run surpluses, they invest in special Treasury securities; when they run cash shortfalls, Treasury redeems those securities to pay benefits, and the government borrows from the public if needed. [4][1]
Total Public Debt Outstanding This is simply the addition of (1) Debt held by the public + (2) Intragovernmental holdings. This is the top-line number on Debt to the Penny. [2][4]
Total Public Debt Outstanding = Debt held by the public + Intragovernmental holdings
Why the distinctions matter:
Debt held by the public is what markets price and what drives interest costs the government pays to outside holders (including the Federal Reserve).
Intragovernmental debt reflects promises among parts of the federal government; it affects future cash needs but doesn’t have the same market dynamics.
Total Public Debt Outstanding is the full legal amount subject to the debt limit (with a few technical exclusions), which matters for statutory debt-limit debates. [4][5] When there are discussion in Congress about the Debt ceiling this is the number discussed.
How deficits add to the National Debt
Each fiscal year, Congress sets taxes and spending. If outlays (spending) exceed receipts (revenue), the government runs a deficit and must borrow by issuing new Treasury securities. Those new securities add to Debt held by the public, and thus to the total debt. The Congressional Budget Office (CBO) publishes baselines and explains the arithmetic and risks of rising Net interest (what the government pays in interest). In 2024, Net Interest on the Debt alone was over $1 Trillion, making it the 3rd largest budget item, larger than National Defense. [5][7][18][22]
In years with a surplus, Treasury can redeem (pay down) outstanding securities or reduce the need to issue new ones—slowing debt growth. But because recent years have seen persistent deficits, the debt has generally climbed. [22]
“Debt to the Penny”
For the Official US National Debt numbers, you can go straight to Treasury’s Debt to the Pennypage. On the site you can:
See today’s total (updated daily except during weekends and holidays) and the split between debt held by the public and intragovernmental holdings.
Download historical CSVs to chart the series yourself.
Check big shifts around tax dates, debt-limit suspensions, or major fiscal packages. [2][15]
Who does what: Role of Treasury vs. the Federal Reserve
The U.S. Treasury (through the Bureau of the Fiscal Service and the Office of Debt Management) issues Treasury bills, notes, and bonds to finance the government at the lowest cost over time. It auctions securities on a regular calendar and redeems them at maturity. Treasury also manages cash (the Treasury General Account at the Fed) to pay the government’s bills. [4][2]
The Federal Reserve (the “Fed”) is the central bank. It does not set taxes or spending and does not decide how much debt the government issues. The Fed’s role here is monetary policy: it influences interest rates and financial conditions. The Fed has a dual mandate to maintain stable prices (control inflation), and manage Employment (manage environment to keep unemployment low). It buys and sells Treasuries only in the secondary market (from dealers), not directly from the Treasury, to maintain its independence and implement policy. [6]
“The Fed does not purchase new Treasury securities directly from the U.S. Treasury, and purchases…from the public are not a means of financing the federal deficit.” [6]
The New York Fed executes these operations for the System Open Market Account (SOMA), the consolidated portfolio of Treasuries and other securities the Fed holds. [12]
What is Quantitative Easing (QE)?
Quantitative easing (QE) is a policy the Fed uses in severe downturns or when short-term interest rates are already near zero. When the Fed is using QE, the Fed buys longer-term securities, such as Treasuries and agency mortgage-backed securities, to push down longer-term interest rates and support the economy. The Fed conducted several large purchase programs after the 2008 Financial Crisis and again during 2020-21 COVID Pandemic. [8][21][14]
Mechanically, when the Fed buys a Treasury, it pays by crediting banks’ reserve accounts at the Fed. That swaps a Treasury security held by the public for a bank reserve (a deposit at the Fed). Crucially, this transaction does not change the total amount of Treasury debt outstanding—it changes who holds it (more at the Fed, less in private hands). [10][6]
“When the Federal Reserve adds reserves…by buying Treasury securities…This process converts Treasury securities held by the public into reserves…[and] does not affect the amount of outstanding Treasury debt.” [10]
Federal Reserve Balance Sheet
Does QE “add to the National Debt”?
No. QE doesn’t authorize or cause Treasury to borrow more or add to the Debt. The deficit determines how much debt Treasury must issue. QE affects yields and liquidity by changing the composition of holders (more at the Fed/SOMA, fewer in private portfolios), not the quantity of debt the government has issued. The Fed repeatedly emphasizes it does not buy securities directly from Treasury or to finance deficits. [6][7][9] (Federal Reserve)
QE can, however, indirectly affect the budget over time through interest rates (lower yields can reduce Treasury’s borrowing costs; the reverse is true when QT—quantitative tightening—lets the portfolio roll off and rates are higher). Several primers walk through these channels. [17][18][7]
How interest flows work when the Fed holds Treasuries
Here’s the accounting workflow in plain English:
Treasury pays interest on all outstanding Treasuries—whether they’re held by a pension fund, a foreign central bank, or the Federal Reserve. That shows up in the budget as Net interest outlays (spending). [18]
When the Fed holds Treasuries (in SOMA), the interest it receives becomes part of the Fed’s net income.
After covering its expenses, the Fed historically remits (gives back) its profits to the Treasury (these are “remittances”). In years when those profits are large, Treasury effectively gets back a chunk of the interest it paid—reducing the government’s overall cost ex post (after the fact). [9][20]
In times (like 2023-25) when the Fed’s interest expenses (mainly interest it pays banks on reserve balances and reverse repos) are greater than its interest income the Fed stops remitting, records a “deferred asset” (an IOU to itself), and resumes remittances only after it returns to positive net income. That deferred asset does not require taxpayer funding; it’s paid down by future Fed profits before any cash flows back to Treasury. [1][5]
“When the Fed’s income exceeds its costs, it sends the excess earnings to the Treasury…When its costs exceed its income, it creates a ‘deferred asset’…and resumes sending remittances after that is paid down.” [1]
Bottom line: whether private investors or the Fed hold a given Treasury, Treasury’s legal obligation to pay interest is the same. The difference is that Fed-held interest often returns back to Treasury (when Fed profits are positive), lowering the government’s ultimate net cost over time. [9][20]
Review of National Debt Concepts
Debt grows because of deficits. Congress’s tax and spending choices determine if there will be an annual deficit or surplus; deficits add to debt. Surpluses reduce the debt. [5][22]
Debt has two big parts. Debt held by the public (including the Fed) plus intragovernmental holdings (trust funds) equals Total Public Debt Outstanding. [2][4] (Fiscal Data)
QE doesn’t “create” more Treasury debt. It changes who holds it and influences rates and liquidity; the Fed buys in the secondary market and does not finance deficits. [6][10][7]
Interest flows are circular when the Fed holds Treasuries. Treasury pays interest; the Fed usually remits (returns) net income back to Treasury; during periods of negative net income, remittances pause and a deferred asset records what will be repaid from future profits. [1][5][20]
You can verify every number daily on Treasury’s Debt to the Penny site, and pair it with monthly public debt reports for detail. [2][4]
FAQ and Common Misconceptions
“If the Fed buys Treasuries, isn’t that just ‘printing money’ to fund the government?” No. The Fed buys from dealers in the open market, not from Treasury. Fed purchases swap Treasuries for bank reserves; they don’t change the amount of debt or directly finance the deficit. [6][10][7]
“Doesn’t the debt count everything the government owes, including future Social Security benefits?” The debt is legal obligations already issued (Treasury securities). Future promises (like future benefits) affect the budget and future borrowing, but they aren’t counted as debt until the government issues securities to pay for them. These are called Unfunded Liabilities (See our Article). Check the Debt to the Penny site for what is counted. [2][4][5]
“Why do some charts focus only on debt held by the public?” Because that’s the portion traded in markets, driving interest costs and macro impacts. It’s also the number most used in economic comparisons (for example, debt-to-GDP). [5]
Debt Guru: How to read the daily debt like a pro
Visit Debt to the Penny site and note Total Public Debt Outstanding.
Compare the split between public and intragovernmental. Persistent deficits typically raise the public share over time.
If rates are rising (or have risen), expect net interest in the budget to climb; CBO’s primers explain why interest costs can grow faster than the economy when debt is large. [2][18][22]
If you want more depth on how the Fed runs these operations, the New York Fed’s archive on large-scale asset purchases and the Board’s description of the System Open Market Account are the canonical sources. [8][12]
Putting it all into Context
If you want to understand how big the National Debt is, how it relates to other things like the size of our economy, how the budget deficits and surpluses compare in charts over the years historically and how that impacts the debt in charts, check out that and more in the Tax Project Institute’s Smarter Citizen App (A Free Citizen App, just register – no credit card and you’re in!)
Treasury security: An IOU the U.S. government sells to borrow money (Bills mature in a year or less; Notes in 2–10 years; Bonds in 20–30 years; TIPS are inflation-protected). Holders earn interest and get their principal back at maturity. [3]
Debt held by the public: Treasury IOUs owned by investors outside the federal government, including the Federal Reserve. [3]
Intragovernmental holdings: Treasury IOUs held by government accounts (e.g., Social Security trust funds). [4]
QE (quantitative easing): The Fed’s large purchases of longer-term securities to lower long-term interest rates when the economy needs help and short-term rates are generally already lower. [21][8]
Remittances: Fed profits (if any) sent to Treasury after covering expenses; paused when the Fed’s interest expenses exceed income (recorded as a “deferred asset”). [5][1]
References
[1] Board of Governors of the Federal Reserve System. (2024, July 19). How does the Federal Reserve’s buying and selling of securities relate to the borrowing decisions of the federal government?https://www.federalreserve.gov/ (Federal Reserve)
[2] U.S. Department of the Treasury, Fiscal Data. (n.d.). Debt to the Penny (daily dataset; coverage back to 1993). Retrieved October 16, 2025, from https://fiscaldata.treasury.gov/ (Fiscal Data)
[3] U.S. Department of the Treasury. (n.d.). Public Debt FAQs (definitions of debt held by the public & intragovernmental holdings). Retrieved October 16, 2025, from https://treasurydirect.gov/ (TreasuryDirect)
[4] U.S. Department of the Treasury, Fiscal Data. (n.d.). Monthly Statement of the Public Debt (MSPD) (monthly dataset). Retrieved October 16, 2025, from https://fiscaldata.treasury.gov/ (Fiscal Data)
[8] Board of Governors of the Federal Reserve System. (2025, September 23). Interest on Reserve Balances (IORB): FAQs (includes note that asset purchases convert Treasuries to reserves without changing outstanding Treasury debt). https://www.federalreserve.gov/ (Federal Reserve)
[10] Board of Governors of the Federal Reserve System. (2016, August 25). Is the Federal Reserve “printing money” in order to buy Treasury securities?https://www.federalreserve.gov/ (Federal Reserve)
[12] Board of Governors of the Federal Reserve System. (n.d.). Fed Balance Sheet—Table 1 (popup): U.S. Treasury, General Account (definition of the Treasury General Account). Retrieved October 16, 2025, from https://www.federalreserve.gov/ (Federal Reserve)
[13] Board of Governors of the Federal Reserve System. (n.d.). H.4.1—Factors Affecting Reserve Balances (current and archived releases). Retrieved October 16, 2025, from https://www.federalreserve.gov/ (Federal Reserve)
[14] Federal Reserve Bank of St. Louis (FRED Blog). (2023, November 20). Federal Reserve remittances to the U.S. Treasury.https://fredblog.stlouisfed.org/ (FRED Blog)
[15] Board of Governors of the Federal Reserve System (via FRED). (n.d.). Liabilities & Capital: Earnings Remittances Due to the U.S. Treasury (RESPPLLOPNWW) (weekly series). Retrieved October 16, 2025, from https://fred.stlouisfed.org/series/RESPPLLOPNWW (FRED)
[16] Board of Governors of the Federal Reserve System. (2024, March 26). Federal Reserve Board releases annual audited financial statements (deferred-asset explanation). https://www.federalreserve.gov/ (Federal Reserve)
[17] Anderson, A., Ihrig, J., Kiley, M., & Ochoa, M. (2022, July 15). An Analysis of the Interest Rate Risk of the Federal Reserve’s Balance Sheet (Part 2). Board of Governors of the Federal Reserve System, FEDS Notes. https://www.federalreserve.gov/ (Federal Reserve)
[19] U.S. Department of the Treasury, Fiscal Data. (n.d.). America’s Finance Guide: National Debt (dataset links and coverage notes—e.g., Debt to the Penny since 1993). Retrieved October 16, 2025, from https://fiscaldata.treasury.gov/ (Fiscal Data)
[20] Data.gov (U.S. General Services Administration). (n.d.). Debt to the Penny (dataset catalog entry and composition note). Retrieved October 16, 2025, from https://catalog.data.gov/ (Data.gov)
[22] U.S. Department of the Treasury, Fiscal Data. (n.d.). Historical Debt Outstanding (long-run series). Retrieved October 16, 2025, from https://fiscaldata.treasury.gov/ (Fiscal Data)
The terms “surplus”, “deficit” and “debt”, or “National Debt”, are often used at the same time, and sometimes interchangeably, but they represent distinct concepts in government finance. Understanding the difference is crucial for grasping the fiscal health of our nation. This article discusses the differences, helps define them and put them in terms Citizens can use.
What is a Surplus & Deficit?
Imagine your household budget for a given period, say a month. You have money coming in (your income) and money going out (your expenses).
Deficit: If in that period you spend more money than you earn, you have a deficit. You’ve spent more than your current income . For a government, a budget deficit occurs when its total expenditures (spending on programs, services, etc.) exceed its total revenues (money collected from taxes, fees, and other sources) within a specific fiscal year (typically October 1 to September 30 in the U.S.) [3]. That is to say Total Expenses exceed Total Revenue.
Deficit
Inadequacy or insufficiency. “a deficit in revenue.”
The amount by which a sum of money falls short of the required or expected amount; a shortage. “budget deficit.”
Deficiency in amount or quality; a falling short; lack. “a deficit in taxes, revenue, etc.”
Surplus: Conversely, if you earn more money than you spend in a given month, you have a surplus. The government experiences a budget surplus when its revenues exceed its expenditures in a fiscal year. This means that your Total Revenue exceeds your Total Expenses and you have money left over [3].
Surplus
Being more than or in excess of what is needed or required: synonym: superfluous. “surplus revenue.”
Being or constituting a surplus; more than sufficient. “surplus revenues; surplus population; surplus words.”
An amount or quantity in excess of what is needed.
What is a National Debt?
Now, let’s extend that household analogy. If you consistently spend more than you earn each month, you’ll likely need to either a) Reduce Spending, b) Increase Revenue, c) Take from Savings, or d) Borrow money (use credit). Your use of credit might be a credit card, a loan from a bank, or borrowing from friends and family. This accumulated borrowing represents your total debt.
National Debt: The National Debt (or public debt) is the cumulative total of all the money the federal government has borrowed over its entire history to cover past deficits, minus any surpluses [1, 3]. When the government runs a deficit, it has to borrow money, usually by issuing Treasury bonds, bills, and notes. This new borrowing adds to the National Debt. When it runs a surplus, it can use that extra money to pay down a portion of the existing debt, or put into funding other programs and services.
While the US Government has mechanisms that you and I don’t have that make it different than a Credit Card, for our analogy the National Debt accumulates like the total balance on your credit card or loan statement, which reflects all the outstanding purchases (expenses) you’ve made over time and haven’t fully paid off (debt). Every time you have a monthly deficit (spend more than you earn and put it on credit), your overall credit card debt increases.
Debt
Something owed, such as money, goods, or services.”used the proceeds to pay off her debts; a debt of gratitude.”
An obligation or liability to pay or render something to someone else.”students burdened with debt.”
The condition of owing. “a young family always in debt.”
National Debt and Deficits in Context, why does it matter?
For the United States, carrying some debt is nothing new, with rare exception the U.S. has carried debt since its inception [2]. Carrying some debt is normal, and perhaps beneficial – say like a Mortgage and a Credit Card bill you pay each month. However, the scale and trajectory of the US National Debt have dramatically changed over the last few years. The US has had some economic shocks that increased the debt rapidly including the 2008 Great Recession, and the COVID Pandemic. What is different now with our current National Debt is that it is the highest it has ever been ($36.95 Trillion) [10] greater than our entire country’s annual economic output of $29.18 trillion in 2024 (Debt to GDP > 100%) [11]. Troubling is that this is a peace time debt surpassing World War II levels of spending. To some, more concerning is that each year we have a deficit in our budget, now exceeding over a trillion dollars annually, that appears to be a structural shortfall. Meaning, the government’s revenue is consistently below its expenses and commitments that isn’t one time or transient, and must borrow each year to meet its funding needs.
The last time the U.S. federal government ran an annual budget surplus was in 2001 [1, 3]. Since then, the nation has experienced a continuous string of deficits (over 20 years in a row). This persistent pattern isn’t just a result of temporary economic downturns; it’s driven by structural deficits.
Structural deficits refer to a persistent imbalance between government spending and revenues that exists even when the economy is operating at its full potential (i.e., not in a recession, or major economic shock) [1, 3]. These are not caused by the ups and downs of the business cycle but by fundamental, long-term mismatches in revenue and expenses [3]. Key drivers of structural deficits in the U.S. include:
Aging Population: As the population ages, programs like Social Security and Medicare face increasing demands, leading to higher spending. Fewer working-age individuals contribute taxes relative to the growing number of retirees receiving benefits [1].
Rising Healthcare Costs: Healthcare costs consistently outpace economic growth, putting upward pressure on government spending for programs like Medicare and Medicaid [1].
Tax Policies: Decisions to cut tax rates without corresponding spending reductions, or a tax base that doesn’t keep pace with the modern economy, can contribute to insufficient revenue.
Increased Spending Commitments: Long-term commitments to various government programs and services, without sustainable funding mechanisms, create an ongoing gap.
These underlying factors mean that even during periods of economic prosperity, the U.S. government is projected to continue spending more than it collects, contributing to the ever-growing national debt [1].
Are Deficits Bad? What about Interest?
Deficits, and Debt spending are not all bad. Government can step in to “prime the pump” in times of economic turbulence to smooth a business cycle, and some government investments add to overall productivity. However, while sometimes beneficial (e.g., during wars, pandemics, or severe economic crises to stimulate recovery), persistent and large deficits are generally not a good thing because they directly lead to a larger national debt, and a larger national debt brings its own set of challenges:
Increased Interest Payments: Just like you pay interest on your credit card debt, the government must pay interest on the National Debt [8]. As the debt grows, so does the amount of interest the government has to pay. If your credit card balance keeps growing, a larger and larger portion of your monthly payment goes just to interest, leaving less money to pay down the principal or for other essential spending.
Real-World Impact: For the U.S. federal budget, interest payments on the national debt have become one of the fastest-growing “programs” [8]. These payments are mandatory and siphon away funds that could otherwise be used for other programs like education, infrastructure, scientific research, defense, or reducing taxes [8]. In 2024 Interest expenses exceeded $1 trillion dollars, passing the US Military as the 3rd largest expense in the Federal budget [12].
Crowding Out Budget Items: As the Interest payments grow, if they get large enough it puts the government in a difficult situation. If they are unable offset the deficits with more Revenue they may be forced to reduce other programs, or add to the Debt compounding the challenge. This has the effect over time of crowding out other government expenses in order to pay the rising Interest expenses.
Higher Interest Rate Expenses: When the government borrows heavily to finance its deficits, it competes with private businesses for available capital in the financial markets [9]. This increased demand for capital can drive up interest rates from investors who are taking on more risk from a highly leveraged seller. Higher interest rates make it more expensive for the government to borrow money to finance the debt. This leads to increasing Interest expenses. For example if you’re constantly maxing out your credit cards, banks might be less willing to lend you money or increase your interest rate to compensate for their higher risk.
Reduced Fiscal Flexibility: A large and growing national debt limits the government’s ability to respond effectively to future crises (like recessions or natural disasters) or to make necessary investments [8]. With a significant portion of the budget already allocated to interest payments, policymakers have less room to maneuver. If your household expenses match your income, an unexpected medical emergency or job loss can be catastrophic if you have no financial buffer or ability to borrow more without extreme difficulty. This can lead to difficult choices, potentially requiring painful tax increases or spending cuts during times when economic stimulus or social support is most needed [8].
Risk of Fiscal Crisis: In extreme cases, if investors lose confidence in a government’s ability to manage its debt, they may demand much higher interest rates or stop lending altogether. This could lead to a fiscal crisis, where the government struggles to pay its bills, potentially causing economic instability, inflation, and a loss of trust in the nation’s financial system [8]. This situation is unlikely to happen in the US as the Reserve Currency in the World, and backed by the US Governments unlimited ability to tax.
US Advantages: The Reserve Currency and Fiat Money
It’s important to acknowledge that for countries like the United States, whose currency (the U.S. dollar) holds reserve currency status, there’s a unique advantage. As the world’s primary reserve currency, the dollar is widely used in international trade, finance, and as a store of value by central banks globally [5]. This creates a consistently high demand for U.S. Treasury bonds, even amidst large deficits, making it easier and often cheaper for the U.S. government to borrow money [5]. Foreign governments and investors are generally willing to lend to the U.S. at relatively low interest rates because U.S. Treasury securities are considered extremely safe and liquid [5]. However, this ability is not unlimited and we may get to a point where that is tested (See our article Return of the Bond Vigilantes).
Furthermore, because the U.S. government issues its debt in its own fiat currency (a currency not backed by a physical commodity like gold, but by government decree), it theoretically has the ability to “print” more money to pay its debts. This gives it a degree of flexibility that countries borrowing in foreign currencies do not possess [5].
However, most mainstream economists believe that while these factors allow for higher debt levels, they do not negate the long-term risks associated with persistent structural deficits and a continuously rising national debt. Even with the reserve currency advantage and the ability to issue debt in fiat currency, there are still significant potential downsides:
Inflation: While printing money can address debt, doing so excessively without a corresponding increase in goods and services (productivity) can lead to inflation, eroding the purchasing power of the currency [7].
Loss of Confidence: Even for a reserve currency, if debt levels become truly unsustainable or if the government appears unwilling to address its fiscal imbalances, investors could eventually lose confidence, leading to a depreciation of the currency and higher borrowing costs as demand moves away from the dollar.
Intergenerational Equity: Accumulating massive debt effectively transfers the burden of repayment (through future taxes or reduced services) to younger and future generations.
It’s worth noting that a minority school of thought, known as Modern Monetary Theory (MMT), holds a different perspective. MMT proponents argue that a sovereign government, which issues its own fiat currency, is not financially constrained in the same way a household or business is [6]. They contend that such a government can always create enough money to meet its obligations and finance spending, as long as it avoids inflation [6]. From this viewpoint, the primary limit on government spending is the availability of real resources in the economy, not the ability to finance deficits [6]. While MMT has gained some academic traction, its policy prescriptions and core tenets remain largely outside the economic mainstream and are considered outside of the mainstream by most economists, who emphasize the importance of fiscal sustainability and the risks of unchecked government spending and debt [7].
Conclusion
In conclusion, surpluses are annual measures of revenue outpacing expenses, deficits are an annual measure of overspending, and the national debt is the cumulative total of all borrowing less surpluses. Persistent deficits lead to growing debt, which in turn leads to higher interest payments, potential crowding out of private investment, reduced fiscal flexibility, and an increased risk of economic instability. While the U.S. dollar’s reserve currency status and the nature of fiat currency provide certain advantages in managing debt, most economists agree that these do not make the nation immune to the long-term structural problems that large and growing deficits entail [13][14]. Addressing these long-term fiscal challenges requires difficult policy choices to ensure a sustainable economic future.
If interest rates rise faster than growth, debt becomes a trap.
I. Introduction – The Spread That’s Breaking the System
For decades, America managed to grow its economy faster than the cost of borrowing. That dynamic kept deficits manageable and debt levels sustainable. But today, a worrying shift is underway: the effective interest rate on government debt (R) is now greater than the real growth rate of the economy (G). In economic shorthand, we’ve entered an era of R > G.
This equation may sound academic, but it has very real consequences. When borrowing costs exceed economic growth, the debt burden doesn’t just increase – it compounds. This creates a growing strain on the federal budget, limiting our ability to invest in future needs.
The R > G concept was popularized by economist Thomas Piketty in his book Capital in the Twenty-First Century, where he applied it to inequality: when the return on capital exceeds the rate of economic growth, wealth concentrates at the top. But the same logic can apply to nations. When the interest rate on debt exceeds growth, public debt compounds and can overwhelm fiscal capacity.
As of 2024, the U.S. national debt reached $36.2 trillion[1], with annual net interest payments of $1.125 trillion, consuming approximately 22.0% of all Federal revenue, according to the latest FRED data[2][3]. This means that more than $1 of every $5 dollars in revenue goes just to service debt. In fact, interest has now surpassed National Defense spending to become the third-largest Federal expense, after Social Security and Medicare[4].
II. What Happens When R > G? A Costly Imbalance
There are negative consequences when the government’s interest payments (R) rise above its economic growth rate (G), and those consequences can build quickly. The result is a compounding debt burden that becomes more difficult to manage each year.
At its core, the National debt grows based on a simple formula:
Debt(T+1) = Debt(T) × (1 + R – G)
Where:
Debt(T) = total debt in the current year Debt(T+1) = total debt in the following year R = effective interest rate on the debt G = real GDP growth rate
As long as Growth (G) exceeds Interest Rates (R), debt tends to shrink relative to the economy – that’s GOOD! But when R > G, even a stable budget with no new spending deficits leads to rising debt as a percentage of GDP – that’s BAD! This is worse in the U.S. context, because the Federal government has run over 20 consecutive years of deficits. We are compounding the problem even before adding the negative effects of R > G.
In 2023, the average interest rate on publicly held debt rose above 3.3%, while real GDP growth hovered near 2%[2]. This gap means the government must devote more revenue for the same services just to stay in place—and even more to reduce debt.
Figure 1 Source: FRED
III. The Cost Spiral: Interest is Crowding Out the Future
Interest on the National debt is now the fastest-growing part of the federal budget. In FY2024, interest payments exceeded $1.1 trillion, surpassing military spending for the first time[3][4].
As interest rises, it reduces the budget available for priorities like:
Infrastructure and clean energy projects
Scientific and medical research
Education, public health, and social services
These tradeoffs are already showing up in budget negotiations. If trends continue, interest could consume more than 25% of federal revenue by 2030, even under conservative projections[5]. That would mean better than 1 in 4 dollars would be spent servicing debt payments. Imagine the dinner table discussion if your credit card interest alone was taking a quarter of your income, that is the situation America could soon face.
Figure 2 Source: FREDFigure 3 Source: FRED, CBO
IV. Why are Interest Rates Rising? What It Means for the Future?
To understand the R > G dynamic, we first need to ask: why are interest rates rising?
Interest rates are set by a combination of factors:
The Federal Reserve’s target rates
Investor expectations about inflation
The supply and demand for government bonds
Since 2022, the Federal Reserve has raised rates to fight inflation. Meanwhile, investors have demanded higher returns to protect against rising prices from inflation. Additionally, increasing government borrowing has added more bonds to the market, pressuring yields upward[6]. All of which are putting upward pressure on interest rates.
Can we control interest rates?
The Federal Reserve’s role in Monetary policy gives them huge power to influence rates, however even they are subject to market forces during their Open Market Operations. So in short, yes they have great influence, but not control and where that control occurs changes based on the term.
Short-term rates? Generally yes, the Federal Reserve sets the Fed Funds rate which sets short term rates.
Long-term rates? No—those are driven by global investor confidence, inflation expectations, and the perceived durability of U.S. fiscal policy and trust in the dollar.
That’s why many economists believe elevated interest rates may persist, especially if inflation remains sticky or if global lenders become more cautious about U.S. debt levels. In fact, nearly $11 billion exited U.S. long-term bond funds in Q2 2025 amid concerns over debt and inflation, while investors favored short-term securities[6]. Federal Reserve Chair Jerome Powell recently emphasized that the Fed will maintain its “wait-and-see” approach due to persistent inflation risks shaped by tariffs and uncertainty[7].
What it means for the future?
When looking at our current situation and what the future may hold, you must evaluate the impact of rising Interest Rates (R) would have on the budget and our debt costs. We created a sensitivity table using our current National Debt to show the effects of a 1% to 3% increase in Interest Rates (R). As you can see the increase in Debt Servicing costs goes up substantially, exacerbating an already challenging problem. Is this likely to happen? Interest rates have been fairly stable and the Federal Reserve monitors this closely, but is it unheard of? In the late 70’s early 80’s with inflation out of control, interest rates peaked over 20%, and were over 10% for more than 3 years, and never dropped below 6% for Paul Volker’s entire term as Chair of the Federal Reserve from 1979-1987.
Avg Interest Rate (%)
Est. Interest Cost ($T)
Increase from 2024 ($B)
0% (2024 Actual 3.36%)
$1.10T (Actual)
0
1% Increase (4.36%)
$1.43T
$327B
2% Increase (5.36%)
$1.75T
$655B
3% Increase (6.36%)
$2.08T
$982B
V. Ignoring the Problem Makes It Worse
The future may come faster than we expect, and this isn’t one of those challenges that if you ignore gets better on its own.
Just a few years ago, some projections warned interest might eventually exceed 30% of Federal revenue[5]. But with today’s rate environment, we’re already at 22%, and climbing – you don’t have to imagine too hard with annual structural Federal Budget deficits adding to the National debt, reaching 30% no longer seems like a stretch.
If left unresolved, rising debt interest may eventually leave policymakers with only difficult choices:
RAISE TAXES: Broad increases that may include middle-income earners
REDUCE SPENDING: Cuts to Social Security, Medicare, defense, or other mandatory programs
PRINT MONEY: Central bank debt monetization—risks inflation or currency credibility
This is no longer a theoretical risk. It’s embedded in the current budget and growing with every year of inaction. Interest is no longer just a line item — it’s becoming as challenging as Medicare, and Social Security entitlements. All growing, or having funding challenges simultaneously.
Figure 4 Source: FRED, CBO
VI. Japan: A Glimpse into the future? A Blueprint to Not follow?
Some point to Japan as evidence that high debt can be sustained without any issues provided inflation remains under control if the debt is held in the states fiat currency. But key differences limit the comparison:
Japan’s debt is largely owned domestically
It has a current account surplus
It battled deflation, not inflation
However, even Japan is now being tested. After years of ultra-low rates and decades of stagnant growth, it has begun reversing policy, increasing interest rates, and weakening the long-standing yen carry trade where people would borrow from Japan at low interest rates and invest in higher returning areas outside of Japan. These shifts have raised Japan’s borrowing costs and led to rising debt service burdens as interest rates rise (R) [8][9].
Analysts from Barclays and the IMF have noted that Japan’s growing interest expenses could strain its fiscal outlook if growth remains weak[10]. This has important implications for the U.S., which faces a more inflation-prone environment and heavier reliance on foreign buyers of US Debt.
VII. How Do We Escape? The Tough but Necessary Choices
Solving the R > G imbalance will require a mix of political will power, discipline, and hard policy choices:
RAISE REVENUE: Greater revenue sources through taxation, tariffs, and fees
SPENDING DISCIPLINE: Slow or reduce spending, reevaluate larger budget items including mandatory spending on entitlements
BOOST GROWTH: Invest in productivity, innovation, infrastructure, and labor force participation
RESTORE FISCAL CONFIDENCE: Send clear signals that America’s Fiscal position is sound to reduce risk premiums
AVOID MONETARY SHORTCUTS: Don’t Print Money to ease debt that risks creating runaway inflation
It is likely to require a combination of a number of these solutions. The solutions are not mysterious—they’re well known. As noted by the Committee for a Responsible Federal Budget, former Fed Chair Ben Bernanke, and former CBO directors, the issue isn’t technical—it’s political will[11].
VIII. Conclusion
We are no longer warning about R > G — we’re living it. It may not scream that the sky is falling or that America will become insolvent tomorrow. However, it is quietly altering the structure of our National budget by crowding out other items, limiting our ability to provide services, putting pressure on our structural annual deficits, and creating growing economic risks that continue to build over time creating great and greater consequences for the health of America’s future.
In the past, fiscal hawks cautioned that rising interest costs could one day consume a dangerous share of revenue. That day has arrived. As of 2024, 22.0% of federal revenue is already going to interest — and rising.
This isn’t theoretical. It’s a structural shift embedded in the fiscal outlook. Every year we delay action compounds the problem. Interest becomes the dominant force in our fiscal future — not a side expense, but a driver of debt itself.
The good news? The earlier we act, the more options we have, and the easier (not easy) managing it becomes. With thoughtful, balanced reform, the U.S. can navigate this challenge and return to fiscal stability. However, it starts with recognizing that this isn’t about politics or beliefs — it’s about math.
Because when the Rate of interest (R) exceeds the rate of Growth (G), time is not on our side.
Tax Project Institute is a fiscally sponsored project of MarinLink, a California non-profit corporation exempt from federal tax under section 501(c)(3) of the Internal Revenue Service #20-0879422.