Tax Day, April 15th, will be upon us soon again. Yes, every year it comes at the same time, but for many it does seem to come quicker each year. There were many changes this year in the One Big Beautiful Bill Act (OBBB). You can get an estimate of your Tax Year 2025 contributions for FREE using the Tax Project Your Contributions tool online. This tool will estimate your Federal, State and various other tax contributions to show your ALL IN CONTRIBUTIONS.
The Internal Revenue Service (IRS) uses the term Tax Gap to describe the difference between (1) the amount of tax that should be paid under the law for a given year and (2) the amount of tax that is actually paid. The IRS calls the first concept “True Tax Liability.” The Tax Gap is used by the IRS as a compliance measurement, intended to quantify how much legally owed tax is not collected. [1]
The Tax Gap is often discussed as if it were a single, objectively identified pool of “missing money.” It is not. The Tax Gap is an estimate, based on direct and estimated assessments of missing revenue. What can be directly observed at scale is what taxpayers report and what they pay, both on time and later. What cannot be directly observed at scale, and hence estimated, is “True Tax Liability” for every taxpayer absent intensive verification. That distinction matters because the Tax Gap is built by combining observed payment/reporting data with audit programs, statistical inference, and projections. It is a useful tool, but it is not equivalent to a ledger of collectible receivables. [1][4] While it is entirely likely that some of the non directly observed amount is in fact a true liability owed by tax payers, how much of the figure is up for debate.
How the IRS estimates the Tax Gap
The IRS does not produce Tax Gap estimates in real time. The estimates are developed in study windows and released with a time lag, reflecting the time required to assemble data, conduct audit-based measurement programs, and model components that are not fully observable. As a result, “the latest tax gap” should be read as the latest official estimate for a particular tax year or tax-year range, not as a current-year dashboard. [1][2]
This lag structure also means year-to-year changes in the reported tax gap may reflect changes in underlying compliance behavior, but may also reflect changes in measurement methods, audit coverage, data availability, and economic composition. The Government Accounting Office (GAO), understanding the limits of what is directly observable, has emphasized the importance of continued methodological improvement and transparency in how these estimates are constructed. [4]
Headline versus Reality
Increasingly common in current political dialogue, the Tax Gap is used as a fixed accounting number that “we just need to collect.” This article will explain the Tax Gap, and why the “no brainer” misconception that we can “just collect the tax gap” is incomplete and potentially misleading. As an estimate based on non directly observed data, it is best thought of as a conceptual framework useful in discussions of efficiency, and potential opportunity and not as a true accounting liability. Before we try to use it as a metric, it is necessary to understand what the IRS means by the Tax Gap, what portion is expected to be recovered anyway, and where the largest uncertainties and constraints arise.
“Imagine what we could do for people with $7 trillion.”
Rep. Pramila Jayapal (D-WA) [11]
Gross vs Net: IRS “not paid on time” vs. “never paid”
The IRS reports the tax gap in two related forms:
Gross Tax Gap: the amount of tax liability that is not paid voluntarily and on time. [1]
Net Tax Gap: the portion of the Gross Tax Gap that the IRS projects will remain unpaid after accounting for what is eventually paid through late payments and enforcement. [2]
The difference between the two is critical. It is the IRS’s estimate of the amount that will be recovered after the deadline through enforcement and other late payments. [2] For Tax Year 2022, the IRS estimated:
Gross Tax Gap: $696 billion
Net Tax Gap: $606 billion
Enforced and Other Late payments delta: $90 billion [2]
This Gross-to-Net adjustment is the first major “Headline vs Reality” issue. Public discussion often treats the gross number as if it were the amount available to be collected with additional enforcement. The IRS’s own framework explicitly says otherwise: a portion is expected to arrive later, and a large residual is expected not to arrive. [2]
The Tax Gap Components
To understand where the Tax Gap comes from and why it is not simply a matter of “trying harder” the IRS decomposes the Gross Tax Gap into three categories:
Non Filing: required returns not filed.
Under Reporting: returns filed but the Tax liability is understated.
Under Payment: returns filed with correct reported liability, but taxes not paid in full on time. [2]
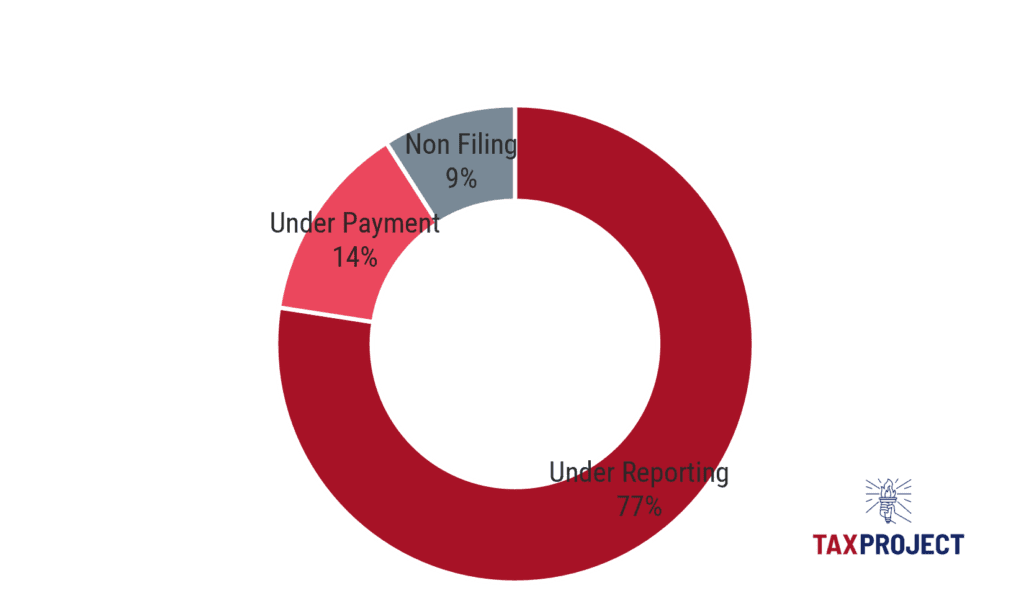
A Treasury Financial Report excerpt summarizing the Tax Year 2022 projections reports the gross gap as $696.0B, comprised of Non Filing ($63.0B), Under Reporting ($539.0B), and Under Payment ($94.0B) (See Figure 1). [3]
These categories represent distinct levels of observability (and hence reliability), liability from an accounting perspective, and they behave differently with respect to enforcement effort often rising significantly the more you try to collect.
Figure 1 The Tax Gap Source: IRS 2022
Non Filing: a detection problem before a collections problem
Non Filing is frequently discussed as if it were merely a matter of pursuing known delinquencies. In practice, Non Filing is often a detection and identification problem. When a person’s income and activity are captured through strong third-party reporting (for example, routine wage reporting), Non Filing is more readily discoverable. Where reporting is limited or activities are less legible to the system, like small and independent businesses, discovery becomes more resource-intensive and uncertain.
Under Reporting: the largest category and the least directly observable
Under Reporting is the largest component of the Tax Gap, and it is also the most dependent on estimation. Under Reporting spans a wide range of situations: simple misstatements, ambiguous interpretations, valuation disputes, and complex structures. [3][4]
Because “true liability” is not directly observable for most underreporting cases, the IRS uses audit-based programs and statistical methods to estimate the magnitude of underreporting and then adjusts for noncompliance that audits are expected to miss (“undetected” noncompliance). The GAO has examined these methods and urged continued steps to strengthen and improve Tax Gap estimation. [4]
This is one of the central reasons the tax gap is not identical to a known pool of collectible balances. A portion of the underreporting estimate is an inference about what is not seen, not a list of identified cases of actual liability awaiting collection.
Underpayment: where collectability constraints are unavoidable
Underpayment is closest to what the public imagines as “money owed but not paid.” It refers to taxes reported on returns that are not fully paid on time. [2] This category highlights the most basic constraint on “just collect it”: assessments and enforcement actions do not guarantee collection, particularly where taxpayers lack the money (liquidity or solvency) to pay.
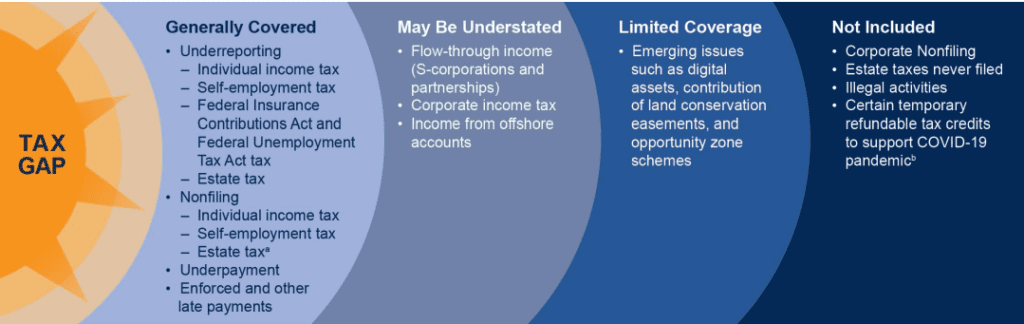
Figure 2 Source: GAO
Measured versus Estimated
The Tax Gap combines observed data with inferred quantities.
On the observed side, the government can directly measure:
What is paid on time
What is paid late
What is collected through enforcement [1][2]
On the inferred side, the government must estimate true liability, especially for Under Reporting, by combining audit results, third-party reporting, and statistical adjustments. [4] The IRS also notes that estimates for more recent tax years require greater reliance on forecasts for eventual late and enforced payments because fewer years of post-filing payment history are available. [2]
This is why the Tax Gap should be read with two simultaneous interpretations:
It is an important conceptual compliance benchmark to identify opportunities.
It is not a fully observed accounting liability, fully collectible stock of “missed revenue.”
Once that is understood, the “no brainer” claim begins to look less like a plan and more like a slogan.
International comparisons challenges
Most countries have some Tax Gap in their collections. Seemingly this would be a straight forward way to check the effectiveness of Government collection efforts. However, Tax gap comparisons across countries are frequently apples-to-oranges, for a structural reason: jurisdictions do not necessarily measure the same types/concepts.
A common example is comparing a whole-system compliance estimate to a single-tax gap such as a Value Added Tax (VAT) gap. The European Commission’s VAT Gap is explicitly about VAT, not about the full tax system. [5] Different tax mixes, different reporting regimes, and different denominators further complicate comparisons.
This does not mean international comparisons are impossible; it means they require careful alignment. Like-with-like comparisons (VAT-to-VAT, income-tax-to-income-tax, or genuinely harmonized “percent of theoretical liability” metrics) are informative. Casual rankings built from mismatched definitions are not. [5]
Enforcement Economics: Diminishing Returns
The political shorthand that “enforcement pays for itself” is not inherently wrong; targeted enforcement initiatives can yield substantial revenue. The problem is treating a high marginal return as a constant that can be scaled to close the entire gap.
Treasury Secretary Jacob Lew was quoted in 2013 saying IRS enforcement spending yields $6 for every $1 spent. [6] Whether that ratio is accurate for particular initiatives at particular times, it does not follow that the same ratio holds as a general average across a large-scale enforcement expansion aimed at the full tax gap.
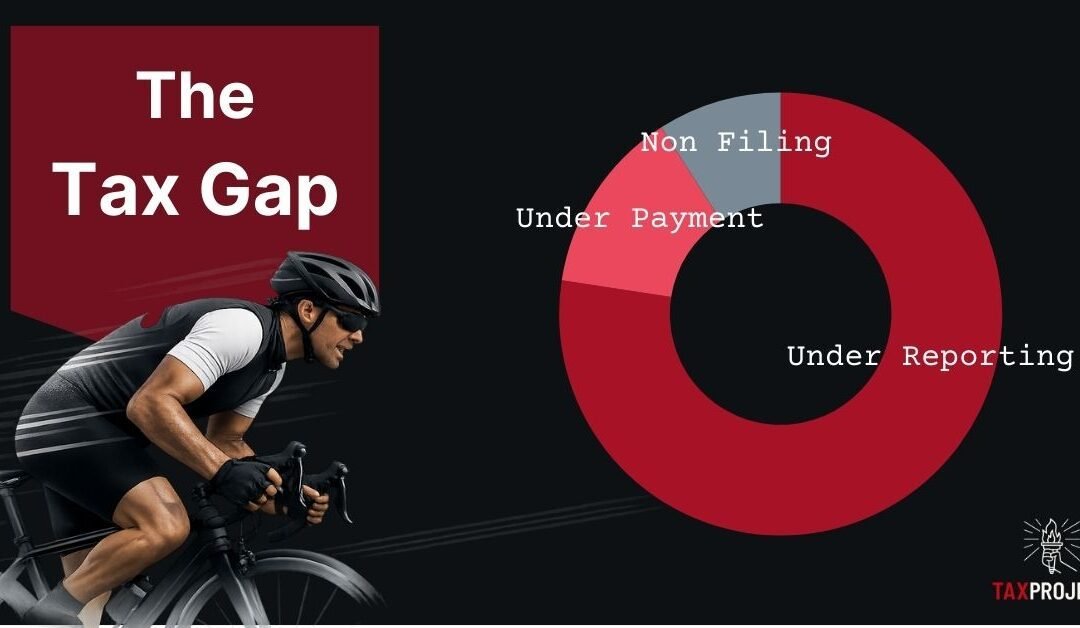
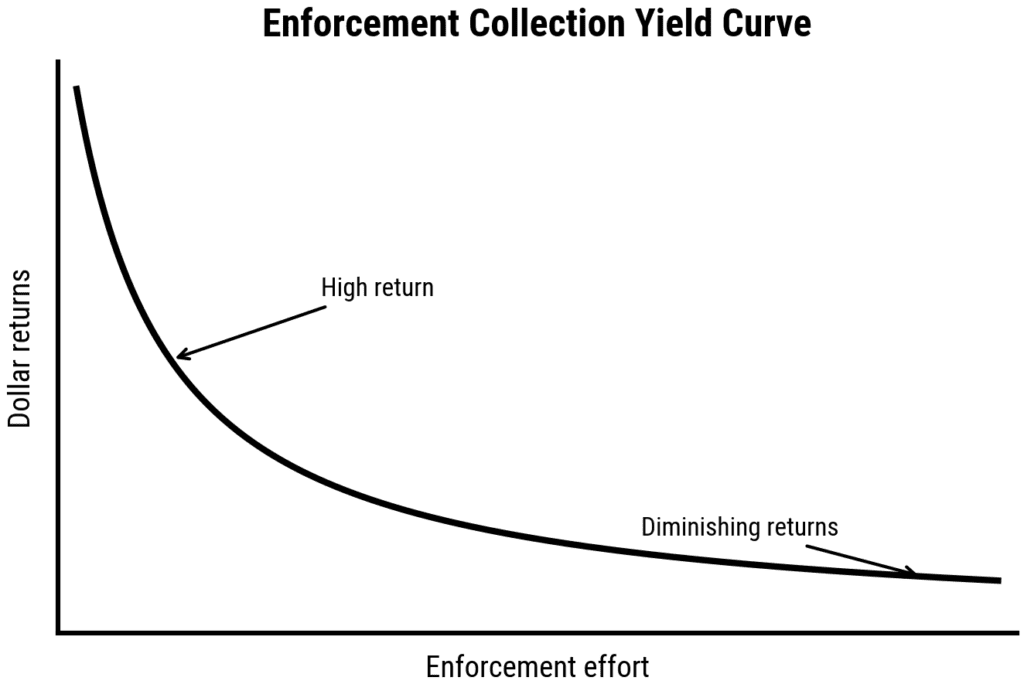
Tax Collection in terms of effort is much like cycling. The amount of effort used while you are going slow is easy, and as you gain speed the amount of effort, and resistance due to wind increases. Each increase is a leap in effort requiring exponentially more effort with each leap. Such is Tax Collection, as collection efforts extend into the long tail—smaller balances, weaker ability to pay, more complicated circumstances collection can become progressively more expensive per dollar recovered. This is a practical constraint that no amount of rhetoric can repeal. In fact, the Congressional Budget Office (CBO) models this into their estimates as the effort increases, the return in revenue drops the more you attempt to collect.
“Thus, in CBO’s estimates, the ROI drops by 10 percent for every 10 percent increase in spending for enforcement and related activities increases”
Congressional Budget Office [7]
CBO explicitly models diminishing returns in enforcement funding. In discussing how changes in IRS funding affect revenues, CBO states that ROI declines as spending for enforcement and related activities increases, providing a rule-of-thumb: ROI drops by 10 percent for every 10 percent increase in enforcement and related spending over baseline. [7]
This modeling choice captures a basic reality: the easiest dollars to collect are collected first. As enforcement expands, agencies move from high-yield opportunities (clear mismatches, strong evidence, high collectability) toward lower-yield opportunities (complex cases, ambiguous positions, weaker collectability, higher dispute and administrative costs). A reasonable way to visualize this is an “enforcement yield curve” where the marginal revenue per enforcement dollar declines as enforcement scales, eventually approaching a low-return tail. (See Figure 3)
The IRS’s own net tax gap concept implicitly reflects this kind of asymptote. Even after late payments and enforcement, the IRS projects a substantial residual remains unpaid. [2]
Figure 3
Biden-era IRS Funding Push
The Inflation Reduction Act provided a major multi-year increase in IRS funding. The public debate often framed this as a means to substantially reduce the Tax Gap, sometimes implying that large sums could be recovered through enforcement and modernization. [8]
In February 2024, Treasury stated that the IRA’s IRS investments would increase revenue by as much as $561 billion over 2024-2034 and cited IRS analysis supporting higher revenue projections than earlier estimates. [8][9] CBO’s general approach, however, is to treat enforcement returns as diminishing and to score them conservatively relative to more optimistic agency scenarios. [7]
The practical interpretation is not that one side is necessarily acting in bad faith. It is that “closing the Tax Gap” is not a mechanical exercise where spending scales linearly into revenue. It is a system where observability limits, administrative capacity, disputes, collectability, and behavioral response create declining marginal returns.
Second & Third Order Effects: avoidance and adaptation
Enforcement is not conducted in a vacuum. When enforcement intensity increases, taxpayers respond. Some responses are lawful, changes in timing, restructuring entities, choosing different tax treatments. Others are unlawful, substitution into less observable forms of evasion. Still others show up as real resource costs—higher compliance spending, higher administrative burden, and greater dispute resolution costs.
These behavioral adaptations are a second reason why the “6:1” ROI cannot be treated as a scalable constant. The more the system stresses a particular enforcement channel, the more taxpayers have incentives to shift behavior toward channels that are harder to police or more efficient from the taxpayer’s perspective (Costlier for the tax collector). At scale, this can reduce the marginal yield of enforcement and can create frictions that affect future taxable activity at the margin.
Even proponents of increased IRS funding recognized the political and practical risks of broad-based enforcement expansion. Secretary Yellen’s 2022 letter emphasized that audit rates should not increase for taxpayers below $400,000 in income, highlighting that enforcement strategy was constrained by legitimacy and feasibility considerations, not merely budget. [10]
Conclusion: a disciplined way to discuss the tax gap
A serious discussion of the Tax Gap should begin with definitions and measurement, not with slogans.
The Tax Gap measures the difference between estimated true liability and amounts paid. [1]
The gross Tax Gap is not the collectible number; the IRS already accounts for late and enforced payments and still projects a large Net Tax Gap. [2]
The largest component, Under Reporting, is also the least directly observable and most dependent on inference and methodological choices. [4]
International comparisons often fail because they compare different taxes, scopes, and denominators. [5]
Enforcement can raise revenue, but returns decline as enforcement scales, and CBO explicitly models diminishing ROI. [7]
Political soundbites such as “$6 for every $1” should be read as claims about limited, high-yield margins, not as a credible strategy to eliminate the entire tax gap. [6][7]
The appropriate framing is not “ignore enforcement,” but neither is it “enforcement will solve it.” The Tax Gap is best treated as a systems problem: strengthen observability where feasible, reduce needless complexity and ambiguity, modernize administrative capacity, and recognize that the last increments of compliance are costly and behaviorally adaptive. Enforcement remains a tool, but it is not a miracle.
See how well you understand the Finances of America. Every American should understand the basic components of how our Government manages the finances of the Country. Only through knowledge are we able to understand the financial state of the country, and thus the health of the country and from this knowledge the ability to make informed decisions.
“Knowledge will forever govern ignorance; and a people who mean to be their own governors must arm themselves with the power which knowledge gives.”
James Madison
Test Government Finance Knowledge
About how much Revenue does the U.S. Federal government collect in a typical recent year?
Order of magnitude: Federal revenues are in the mid single-digit trillions, not billions. For example, in Fiscal year 2024 the federal government collected about $4.9 trillion in revenue. That was just under 20% of U.S. GDP for that year. Learn more: Federal Revenue overview.
Order of magnitude: Federal revenues are in the mid single-digit trillions, not billions. For example, in Fiscal year 2024 the federal government collected about $4.9 trillion in revenue. That was just under 20% of U.S. GDP for that year. Learn more: Federal Revenue overview.
The United States in the mid-1940s, the country had just financed the most expensive and bloody war in history. Something new is occurring: paychecks for the first time begin withholding income tax out of those paychecks as they are earned. The so called “Gold Standard” where Gold backs every dollar as a legal promise is gone for Americans. The Federal Reserve is learning how to steer interest rates for a peacetime economy. Beardsley Ruml, a former Macy’s finance chief turned New York Federal Reserve chair steps into this backdrop and writes an article in the January 1946 American Affairs publication with a simple but provocative statement:
“Taxes for revenue are obsolete.”
Beardsley Ruml
He isn’t trolling – he meant what he said. He’s telling readers that the way money works has changed, and if we keep thinking about Federal taxes like a family checking account, “first earn, then spend”, we misunderstand how money works in a fiat currency not backed by a hard asset (like gold) and what taxes actually do in a monetary system. The government no longer needs to wait for tax revenue to spend. Stop for a second and think about this statement, it is a Matrix like moment where Morpheus asks Neo if he wants the Red Pill or the Blue Pill. The Red Pill represents the truth and how fiat currency actually works, and the Blue Pill represents just ignoring the truth and going back to your comfortable understanding of how money works. A full copy of Ruml’s Thesis can be found here.
Fiat currency is money that is not backed by a physical commodity like gold or silver, but is instead backed by the government that issued it. Its value comes from the public’s trust and the government’s authority, which decrees it as legal tender. Examples of fiat currency include the U.S. Dollar, the European Union’s Euro, and the Japanese yen.
The Backdrop for Ruml’s Thesis
When Beardsley Ruml wrote “Taxes for Revenue Are Obsolete,” he was synthesizing his experiences of how American money actually worked, and the changes going on around him. As a Federal Reserve chair, participant in Bretton Woods, and someone who shaped policy, like Pay as you go payroll, he had a first hand view.
1933–1934: Off domestic gold—constraint shifts inside the border
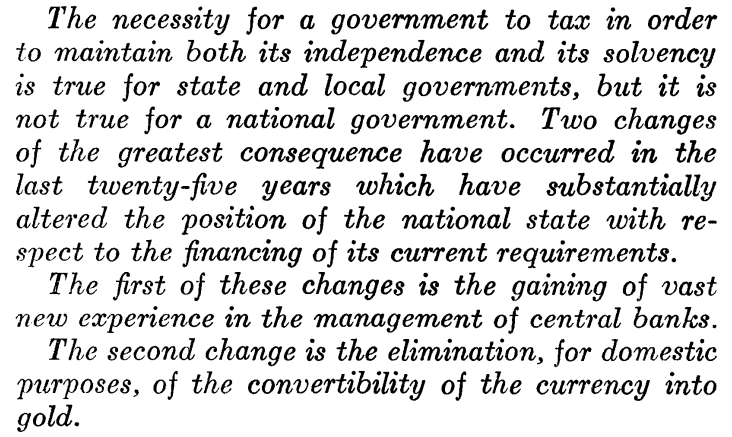
In the early New Deal years, the U.S. ended domestic gold convertibility and reorganized the gold regime under the Gold Reserve Act. Inside the country, dollars were no longer legally IOUs for a fixed weight of metal. The binding constraint on federal finance began to migrate from gold reserves to inflation, real capacity, and statute (law). Ruml’s essay explicitly ties his thesis to this inconvertible-currency reality: a national state “with a central banking system… [whose] currency is not convertible into any commodity.” [1]
“Final freedom from the domestic money market exists… where [there is] a modern central bank, and [the] currency is… not convertible into gold.” [1]
1942–1943: Pay-as-you-go withholding—taxes become continuous
With wartime employment booming, Ruml helped push paycheck withholding (the Current Tax Payment Act of 1943), turning the income tax from an April settlement into a real-time flow. Withholding didn’t just improve administration; it made taxes a live instrument for managing purchasing power across the year, reinforcing Ruml’s view that taxes should be judged by effects—on prices, distribution, and behavior rather than as a cash bucket to “fund” future outlays (spending). [5]
1944–1946: Bretton Woods and the New York Fed vantage point
As Bretton Woods took shape (par exchange rates, gold convertibility for foreign official holders, capital controls), Ruml was chairman of the New York Fed (wartime through 1946). He watched the Fed support Treasury borrowing for war finance and then toward peacetime normalization. In that setting, Ruml saw operationally how Treasury spending settled through the Federal Reserve, and how taxes and bond sales later lowered purchasing power and supported interest-rate control. He previewed his thesis in a 1945 address and then published the 1946 essay, sharpening the claim that taxes are essential for what they do, not to generate revenue before spending. [1]
“All federal taxes must meet the test of public policy and practical effect.” [1]
1951: The Treasury–Fed Accord—roles clarified
Ruml’s essay was given before the Treasury–Fed Accord, but the Accord (1951) confirmed the institutional direction he was pointing toward: monetary-policy independence to target rates and prices, separate from Treasury’s debt-management imperatives. After pegging wartime yields, the Fed reclaimed the ability to resist fiscal pressure when inflation called for tighter settings—strengthening the case that budgets should be judged by employment, prices, and distribution, not balanced-budget rituals. [3]
Ruml died in 1960, but his logic became even more straightforward after Nixon suspended official dollar–gold convertibility and major currencies moved to floating exchange rates. From then on, the United States was unambiguously a fiat-currency issuer: spending cleared through the Fed first; taxes and bond sales followed to manage inflation, distribution, market structure, and interest rates. Ruml’s once-provocative line read less like heresy and more like a plain description of operations—with the real constraints now fully on inflation, capacity, and institutional credibility. [4]
“The public purpose… should never be obscured in a tax program under the mask of raising revenue.” [1]
So the events and experiences: moving internally away from gold backed assets at home (1933–34), real-time taxation (1943), Fed Monetary Autonomy (1951), and externally away from gold (1971–73) together explain how Ruml could say, without gimmicks, that taxes are essential for what they do: price stability, distribution, behavior, and currency demand—rather than as a prerequisite to spend. He believed the question for any program was:Can the real economy deliver, and how will policy manage the price-and-capacity path along the way?[1][3][4][5]
Follow the dollar: how “mark-up” works
To see understand Ruml’s Thesis more concretely, we can use by example a single payment.
A federal contractor finishes a bridge repair job. Treasury authorizes payment to the contractor. The Federal Reserve, which is the government’s bank, marks up the contractor’s checking account at their commercial bank. Two things happen at once:
The contractor’s deposit goes up (their balance goes up, they have more spendable money).
The contractor’s commercial bank’s reserve balance at the Fed goes up (the bank’s settlement cash).
No one at the IRS had to collect that exact amount yesterday for this payment to clear today. In other words, the government did not have to wait for revenue before spending. The payment clears because the United States operates the dollar system. Once that payment is made, taxes later can remove some of those dollars from private hands; and bond sales can swap some deposits/reserves for Treasury securities to help the Fed keep interest rates where it wants them.
That’s the basics of Ruml’s claim. In a fiat system with a central bank, spending isn’t bottlenecked by prior tax receipts. The real limits are inflation and real capacity – how many workers, machines, homes, kilowatts, and microchips the economy actually has.
“Federal taxes can be made to serve four principal purposes…” [1]
Ruml’s Four Functions for federal taxes then are as follows:
Price stability (control inflation by removing purchasing power when the economy runs hot)
Distribution (redistributing wealth (purchasing power) based on policy)
Behavior/structure (altering behavior with economic incentives e.g. carbon, tobacco, alcohol, etc.)
Currency demand/legitimacy (creating demand for currency by requiring Federal taxes be paid in Dollars)
Questions from Ruml’s thesis
Not only was Ruml’s thesis provocative, if true it brings up a whole set of new questions, and challenges a lot of our notions of money and taxes.
Question: If spending can come before tax revenue, and the government doesn’t need it to spend, why are we paying taxes at all? This is the heart of Ruml’s Thesis, that while the government did not need taxes to allow the government funding to spend, taxes did play an important role. Ruml believed taxes were a way to manage price stability (inflation): they help keep prices in check by reducing purchasing power (demand), they shape who holds purchasing power, and they anchor the currency by requiring dollars to settle tax bills. Without taxes, you could spend for a time but you would lose price stability and the public’s confidence in the stability of the dollar itself.
Question: Why do politicians still ask “How will you pay for it?” if taxes aren’t needed to spend? Because you hit walls long before you “run out of money”:
You can’t print money for Imports. If spending weakens the value of the dollar, import prices jump or supplies dry up. That impacts living standards fast. [18][19][20]
Boom–bust finance. Prolonged easy fiscal + easy money can inflate asset and credit bubbles; when they pop, banks retrench and recessions deepen—costlier than using modest drains (purchasing power reductions) earlier. [9]
Tax-base erosion (seigniorage limit). If people expect rising prices and weak policy response, they flee into hard assets/FX; real tax intake falls just when control is needed (seen in hyperinflations). [16][17]
Real-world choke points. Money doesn’t increase productivity, create nurses, build cars, ports, or grid lines; increasing demand into bottlenecks yields price instability, not output. [10][12][13][14]
Interest-cost feedback. Rate hikes to cool inflation raise government interest bills, shifting income toward bondholders and forcing tougher trade-offs later. [11][9]
Predictable Policy keep costs low. Predictable authorizing/phase-out rules lower risk and support long-term contracts; junk the rules and borrowing costs/investment worsen even before inflation moves. [11][9]
Ruml’s point isn’t spend in excess, it’s that taxes aren’t required to spend. Taxes and pacing are the governors that keep prices stable, protect access to vital imports, prevent financial bubbles, and align demand with what the real economy can actually deliver. [1][2][3][6][7]
Question: Why not just make everyone a billionaire? This is an interesting thought exercise, if everyone was a billionaire would the purchasing power of the currency be the same? Since money is a claim on real output, not actual output (productivity) if everyone was a billionaire most certainly the purchasing power of the fiat currency would be substantially lower. More money without more productivity (nurses, houses, energy, widgets, etc.) brings higher prices (inflation), not greater prosperity. Ruml’s thesis keeps taxes (and other monetary mechanisms to reduce purchasing power) in the toolkit precisely to match purchasing power to capacity.
Japan: Use Case and cautionary tale
Japan is the cleanest real-world test of part of Ruml’s thesis. For decades, Japan’s gross public debt sat well above 200% of GDP—yet long-term interest rates were near zero under Bank of Japan (BOJ) policy. The Yen has had no solvency crisis, of major uncontrolled inflation. That supports Ruml’s point that a nation which issues debt in its own currency faces inflation and capacity constraints more than a “running out of money” constraint [12][13].
However, during the same period shows why Ruml’s mechanics don’t solve the growth problem by themselves:
The “lost decades.” Japan endured a multi decade stretch of weak real growth and disinflation/deflation. Even with easy financing conditions Japan was not able to create growth and productivity improvements or new sectors on their own [14][16].
Balance-sheet hangover. After the 1990s asset bust, households and firms deleveraged for years—private demand stayed weak even when public deficits filled part of the gap.
Wages and demographics. An aging population, shrinking workforce, and corporate practices contributed to sluggish productivity and flat real wages for many workers [14][16].
Foreign Exchange (FX) and imported prices. Episodes of yen weakness raised import costs (notably energy), squeezing households and complicating the path out of very low inflation.
Policy evolution. The BOJ cycled through low rates including zero and even negative interest rates for 8 years!, Quantitative Easing, and yield-curve control, then gradual adjustments. These tools stabilized finance but didn’t create robust growth, reminding us that supply-side capacity (energy, housing, innovation, corporate reform) still determines living standards.
Monetary sovereignty may avoid immediate solvency issues in your own currency, but prosperity still depends on productivity, demographics, and the supply side. The policy art isn’t printing more money; it’s about managing the balance between demand and capacity so money meets output rather than outruns it. [12][14][16]
Where Ruml’s Thesis fails
Ruml presumes monetary sovereignty – you tax and spend in your own currency, with credible institutions, and you don’t owe large amounts in someone else’s money, or require external inputs like energy, food, or other goods and raw materials. It also assumes you don’t outspend the productive capacity of the country. If and when those conditions vanish, significant and detrimental impacts could fall upon the country. There are a number of examples of hyper inflation, that have damaged the economic and well being of countries.
Weimar Republic Germany (1921–23). Huge reparation obligations (external), political fracture, and aggressive central-bank financing into a collapsing anchor produced hyperinflation. The issue wasn’t “deficits” in the abstract; it was external liabilities + institutional breakdown + supply dislocation [18].
Zimbabwe (2000s). Radical output collapse (agriculture and supply chains), governance failures, and money creation against shrinking real capacity drove prices into hyperinflation. Too many nominal claims, too little real output [19].
Sri Lanka (2022). A foreign-currency crisis: depleted FX reserves, weak tax base, and large hard-currency debts. You cannot print your own fiat money when your liabilities are in dollars/euros; the constraint becomes imports and external financing, not domestic “solvency” [20][21][22].
Ruml’s Thesis exists when you issue your own currency, are not dependent on externalities or foreign debt, and spending does not outpace productive capacity and credibility in currency is maintained. Lose those – and inflation, devaluation, and/or default can take the driver’s seat.
How most Economists think about Ruml’s Thesis
Most modern economists agree on the operational basics: in a fiat currency system, the Treasury and central bank can ensure payments clear in the home currency; taxes/bonds then drain purchasing power and help the central bank hit an interest-rate target. That’s not controversial [6].
Where Economists caution starts – real life, not the textbook:
Prices can jump if demand outruns supply. If new spending hits an economy short on cars, nurses, chips, or houses, prices rise. That happened in 2020–22 during the COVID Pandemic: demand recovered while supply was jammed. Changing taxes or budgets is slow, so economists like built-in brakes (automatic stabilizers) and phased rollouts. [6][7][2]
Higher interest rates make debt cost more. The U.S. can always pay in dollars, but when the Fed hikes to fight inflation, the interest bill on government debt climbs. If that bill grows faster than the economy or tax revenue, Congress faces tougher trade-offs. Last year Net Interest on the US National Debt was over $1 trillion. The 1951 Accord exists so the Fed can fight inflation even if it makes borrowing costlier. [3][10][11]
Consumer Sentiment and Beliefs matter. Prices stay more stable when people trust leaders will cool inflation off if needed. If policy looks like “spend without limits,” businesses and workers build in higher inflation into their cost models and pass that along, and it’s harder to bring back down once its gone up.
Not every side effect shows up in the Consumer Price Index (CPI). Inflation can manifest itself in many ways that trickle down to the ordinary consumer in ways that aren’t tracked well by major indexes like the CPI. Big deficits with low rates can push up stock and house prices and widen wealth gaps, even if everyday inflation isn’t high. That can erode support for useful programs. [10]
At full tilt, something has to give. When the economy is already near full capacity, more public spending creates demand that competes with private demand for the same workers, resources, and materials. The result isn’t “no money”; it’s higher prices or shifting resources away from something else. This can be managed with taxes destroying demand, phased timing reducing demand peaks, or adding supply.
America, and most countries are deeply intwined in Global Trade We import energy, food, critical resources, and key parts from a Global Supply chain. If the dollar weakens or suppliers get nervous, import prices rise and shortages can appear. Building domestic capacity (energy, logistics, housing) and self sufficiency can offset that, but it also comes at a cost.
Where Economists actually stand on Ruml’s thesis
Broad agreement on the plumbing: Most economists accept that in a fiat system the government can pay first in its own currency, and that taxes/bonds are tools to manage demand and interest rates. That’s mainstream (see the Bank of England explainer). [6][7]
Support for using deficits in slumps: In recessions or emergencies, many economists favor deficit spending to protect jobs and speed recovery. (Ruml’s taxes aren’t required for spending fits this.) [6][7]
Caution about pushing it too far: Many are wary of treating “spend first” as a green light without a clear plan for inflation, ensuring demand doesn’t outpace supply and productive capacity, and the outside world (Global trade, key economic inputs from outside the U.S.). They stress guardrails, automatic stabilizers, and credible roles for the Fed and Congress (the spirit of the 1951 Accord). [3][10][11]
Split on the stronger claims (often linked to MMT):
Critics say relying mainly on taxes to stop inflation is too slow and political, and they worry about fiscal dominance (pressuring the Fed to accommodate debt). They also flag open-economy risks and asset-price side effects. [9]
Supporters respond that good design (automatic tax/benefit adjusters, phasing, targeted drains) can handle those issues, and that recognizing the fiat mechanics helps us focus on real limits (people, machines, energy) rather than imaginary cash limits. [9]
Economist View Summary:
They mostly agree on the mechanics.
They agree deficits can be useful tools.
They differ on how far you can push spending before you risk inflation, financial stress, or FX problems
They differ on whether taxes can be used quickly and fairly enough to cool inflation off. [6][7][3][10][11][9]
A Ruml-style way to judge any Spending program
The Congressional Budget Office estimates the cost and budget impact of programs. Using a Ruml Thesis style way to evaluate programs might look something like this.
Capacity: Do we have the people, skills, materials, energy, and productive capacity? If not, what’s the plan to expand supply?
Inflation plan: If demand overheats, what automatic brakes kick in—phasing, adjustable credits, temporary surtaxes? [2]
Distribution: Who gets the new purchasing power and who gives something up?
External exposure: Are we import or FX sensitive in the relevant inputs? Do we hold external exposures?
Institutional alignment: Are fiscal choices made with a central bank focused on price stability (the post-1951 lesson)? [3]
Summary: Ruml’s answer to the question
In summary we ask the title question: “Are taxes needed,?” Ruml’s answer—in his own words—is that their revenue role is not the point in a fiat system:
“Taxes for revenue are obsolete.” [1]
They are needed for what they do: to keep prices stable, shape distribution and behavior, and anchor demand for the dollar:
“Federal taxes can be made to serve four principal purposes…” [1]
And the standard for judging them is not myth or ritual but outcomes:
“All federal taxes must meet the test of public policy and practical effect.” [1]
Read that together and you have the summary of his thesis: the United States does not tax so that it can spend; it taxes so that the money it spends produces stable prices, fair distribution, incent certain behaviors, and ensure a credible currency. While his beliefs were provocative at the time, and still controversial, the mechanics of his thesis remain true and you can see his influences in the roots of Neo Chartalism, Functional Finance and all the way to Modern Monetary Theory (MMT) today.
As you grow older, you become more self assured, knowledgeable and more independent – able to make many decisions on your own. At some point in your teenage years, you may come to believe in your infallibility, and how correct you are in all things. As you get older, life has a way of teaching you new lessons, and if we were smart and true to ourselves there were probably lessons that our parents tried to teach us many years before and we were too smart at the time to listen. When you become a parent, you come to realize many more of those lessons after the fact. One big lesson for parents is that you can’t make decisions for your children all of the time, for one they won’t always listen, and two – they need to learn on their own. You try to protect them from the things that will really hurt them or having lasting effects, but sometimes a little blood and skinned knees can be way more instructive than any parental chat.
“When I was a boy of fourteen, my father was so ignorant I could hardly stand to have the old man around. But when I got to be twenty-one, I was astonished at how much the old man had learned in seven years.”
Mark Twain
Wisdom of the Mom: What we can learn from mothers
One lesson we learned, and we didn’t even realize we were being taught, was the “You Slice, You Choose” game. The “game” was simple, usually there was something desirable like a Pie and your mother would designate one person to slice, and another person got to choose which slice to take. Simple, but devious – at first glance without a lot of thought a young lad may think if I get to slice, I can slice a bigger piece of the pie. A wiser, more experienced child will realize that any deviation by the slicer from the center was a gain for them as they would invariably choose the larger slice. Overtime, as everyone knew the game the slices became more and more even, and the “game” self enforced fairness without any policing or intervention from parental units. After a while, you could swear that each slice was done by a computer aided laser in the planning and precision of the pie slice so perfectly even down the middle. Many years later, you marvel at the wisdom of mothers and wonder what other ancient mysteries and riddles could these geniuses have solved if their life mission wasn’t wasted helping you slice pie.
Mom and the Budget
Every year now it seems like the Federal Budget is now in play as a game piece to be negotiated by both parties trying to gain advantage over each other. Even though everyone knows the dates and when the deadline is, it always seems to go right up to the end, and in this case over the deadline. Such is the case in the partisan environment we live in today. However, I’m struck that it’s really nothing more than a high stakes game of “You Slice, You Choose.” That may over simplify it by quite a bit, but the fundamentals are the same.
Pie Analogy
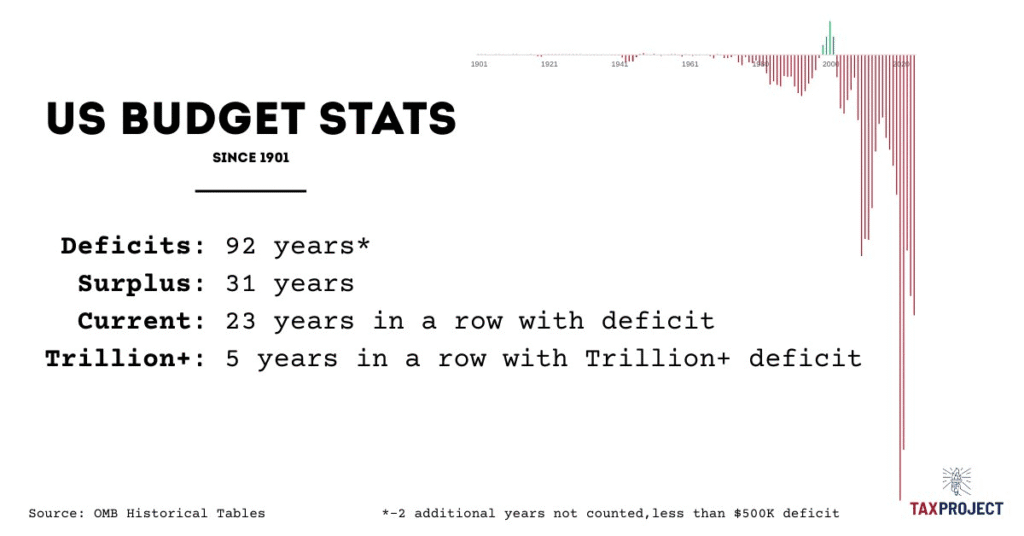
Our Federal Revenue is the ingredients for the pie. Our Federal budget is the size of the pie. Some years the pie will be larger than what you can eat, known as a budget surplus, and you can put some in the fridge for later. Other years you can borrow extra ingredients to have a bigger pie now at the expense of smaller pies in later years, known as a budget deficit. Much like pies in our household, there was never enough. Since 1901 we’ve had 92 years of budget deficits.
Figure 1
Our debt keeps growing, as well as the interest on the debt. Each year eating more and more pie.
Pie Dynamics
Before you even slice the pie, you realize several pie dynamics are at play. The amount of ingredients each year, the more ingredients the bigger the pie – so as Revenue grows, so does the size of the pie. The size of pie we make is dependent on the quantity of ingredients we have, and if we choose to leave some pie for later (surplus), or we decide to borrow ingredients from the future (deficits) with the potential consequence of having to reduce the size of future pies.
Pie Slicing
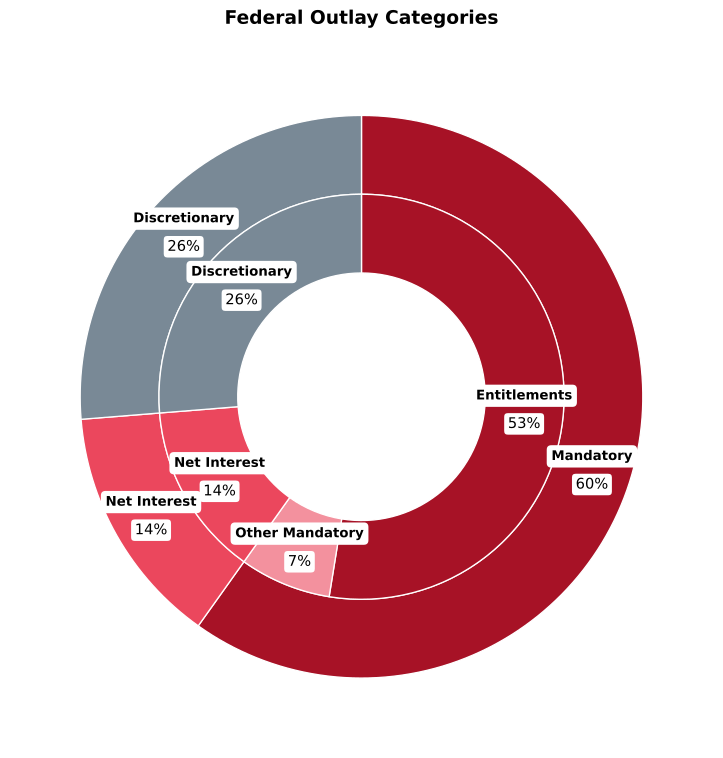
After you understand the pie dynamics, you can begin the process of slicing. However, before you slice you want to have any idea of how you want to divvy up the pie, and knowing with the Federal Budget almost 3/4’s (74%) of the pie is already gone before you slice it allocated to Mandatory and Net Interest components. The Net interest is all the extra pie we had in previous years. The more we add to the deficit, the larger it get. As it keeps growing, the smaller and smaller the pie available is in the future. Unless new laws are passed, the debate is in the quarter of the pie designated as Discretionary. However, even many of those don’t feel discretionary like National Defense – you could cut it back, but you probably aren’t going to eliminate it.
Figure 2
Pie – Choosing your Slice
So the only thing left is tough choices. Slicing can be a painful process, because when it comes time to choose – you realize that something you may have wanted more of shrunk, and something you wanted less of grew and you are stuck with that choice. Unlike in the family edition of the “You Slice, You Choose” game, both parties participate in the slicing and choosing. There is no self reinforcing fairness mechanism other than the active participation of engaged and informed citizens. This is the game Congress must play each year.
Pie in the Sky
Increasingly, people bring up MMT (Modern Monetary Theory). Using our pie analogy, according to MMT as long as inflation is in check, your pie can be as big as you want it to be. We wish these Economists were available to instruct our parents. Alas, in our household there was no magic infinitely growing pie, just tough choices. Until such time as an infinite pie becomes available, we’ll have to face touch choices as a country.
You Slice, You Choose
Summary
The Federal Budget is much more complicated, and the outcomes and consequences much more serious than a game of “You Slice, You Choose” but the lessons from Mom are none the less instructive. We all have to choose between tough choices, we all have to make reasonable assumptions and trade offs, and create mechanisms for fairness and balance that reinforce themselves automatically and fairly. In the game of life understanding Government Financial Literacy gives us the tools to understand the rules of the game, how to participate, and understand the dynamics, and trade offs that must be made in order for all of us to thrive. We learn many lessons in life, some of them stick with you. Thanks mom, I miss you every day.
Tax Project Institute is a fiscally sponsored project of MarinLink, a California non-profit corporation exempt from federal tax under section 501(c)(3) of the Internal Revenue Service #20-0879422.