|
Input Risk |
Housing cost squeeze |
Housing takes too much of a household’s income, whether through rent, mortgage, insurance, taxes, or related costs. |
Housing is usually the largest family expense. When it rises too much, it crowds out saving, ownership, mobility, and family formation. |
|
Input Risk |
Pay not keeping up |
Earnings do not rise fast enough to match the cost of living. |
People may be working just as hard, or harder, without feeling like they are moving forward. |
|
Input Risk |
Medical cost burden |
Health insurance, out-of-pocket costs, and medical risk create financial strain. |
A health shock can quickly become a financial shock, especially for middle- and lower-income households. |
|
Input Risk |
Child care and family cost burden |
The cost of raising children and supporting family life becomes harder to afford. |
High family costs can delay marriage, reduce fertility, and weaken household stability. |
|
Input Risk |
Wealth and ownership barriers |
Homes, savings, and investment assets become harder to buy or build. |
The American Dream is not only about income. It is also about ownership, savings, and long-term security. |
|
Input Risk |
Education cost and mismatch |
Education is expensive, and in some cases does not translate into better job opportunities or earnings. |
School should help people move up. When the return is weak or the cost is too high, mobility suffers. |
|
Input Risk |
AI disruption without broad gains |
AI changes work and production, but the gains may be concentrated while disruption is widely felt. |
AI could raise productivity, but it could also weaken job ladders and concentrate wealth and bargaining power. |
|
Input Risk |
America’s ability to build, invent, and grow |
The country becomes weaker at starting businesses, scaling innovation, adopting new technology, and raising productivity. |
Long-run quality of life depends heavily on productivity, innovation, and dynamism. |
|
Input Risk |
Debt and fiscal-credibility strain |
Rising debt, deficits, and interest costs reduce flexibility and confidence in the nation’s finances. |
Over time this can crowd out productive investment, raise future burdens, and weaken resilience. |
|
Input Risk |
Energy security and cost |
Energy becomes too expensive, unreliable, or constrained. |
Energy affects nearly everything: household budgets, industry, transport, digital infrastructure, and national competitiveness. |
|
Input Risk |
Demographic aging and dependency burden |
The population gets older and there are relatively fewer workers supporting more retirees and dependents. |
This can slow growth, strain public finances, and weaken generational progress. |
|
Input Risk |
Institutional durability and governance quality |
Public institutions become less effective, less trusted, or less able to solve problems. |
If institutions weaken, even solvable problems can linger and compound. |
|
Input Risk |
Industrial and supply-chain resilience |
The country becomes more dependent on fragile or foreign production networks. |
Weak resilience makes the economy more vulnerable to shocks, shortages, and strategic pressure. |
|
Input Risk |
Great-power rivalry and geopolitical fragmentation |
Strategic rivalry, bloc formation, or global instability create economic and political stress. |
This can raise security costs, disrupt trade, and weaken global stability. |
|
Input Risk |
Dollar and monetary-system durability |
The long-run strength and trust in the U.S. dollar and related financial system weaken. |
This is more of a long-horizon systemic risk, but it matters because it affects flexibility, borrowing, and confidence. |
|
Input Risk |
Climate, insurance, and place risk |
Environmental stress raises insurance costs, damages property, and makes some places harder to live in or insure. |
This can directly reduce affordability, stability, and regional opportunity. |
|
Input Risk |
Government inefficiency and weak public value |
Government services and spending deliver less value than citizens expect for the taxes paid. |
It reduces trust, wastes resources, and weakens the public side of quality of life. |
|
Input Risk |
Inflation in essentials |
The cost of food, energy, rent, health care, and other basics rises faster than households can absorb. |
Essentials matter most because families cannot easily avoid them. |
|
Input Risk |
Crime and disorder |
Safety and public order weaken in ways that affect daily life and community confidence. |
Severe in some places, but generally more localized than the top structural pressures. |
|
Input Risk |
Civic disengagement and trust erosion |
People participate less in civic life and have less confidence that the system is fair or responsive. |
This weakens the country’s ability to self-correct. |
|
Input Risk |
Major war or security shock |
A major military or geopolitical shock disrupts the economy and public life. |
Low-frequency, but potentially very high impact. Included as a systemic fragility risk. |
|
Super Macro |
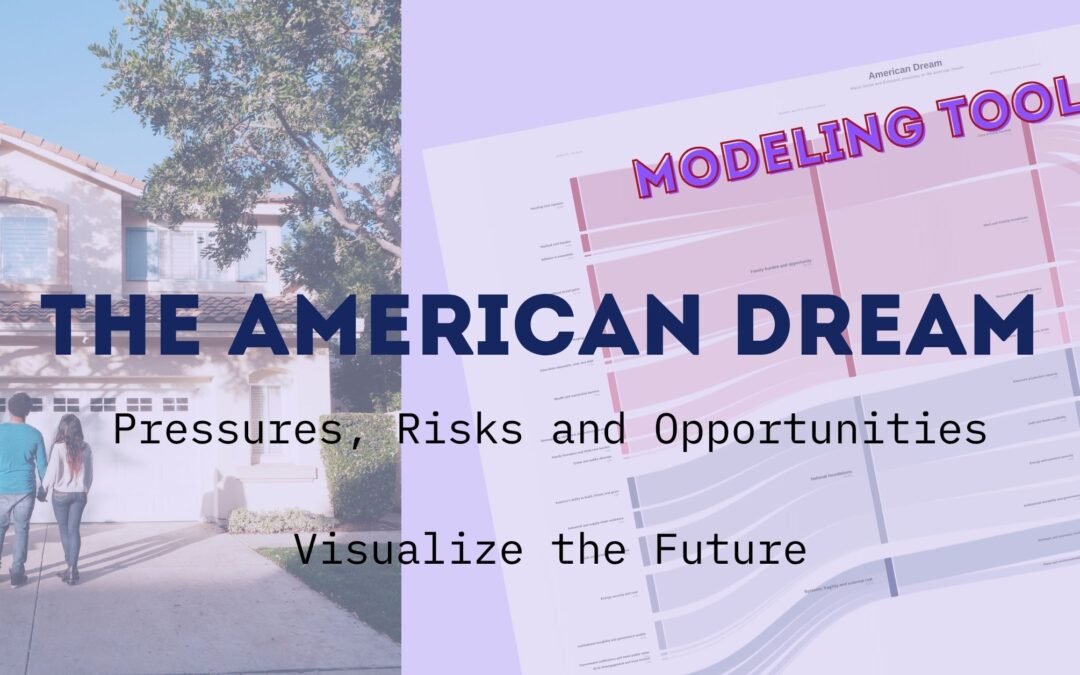
Family Burden and Opportunity |
Pressures that directly affect the day-to-day ability of households to afford life and move up. |
This is where families feel the American Dream most immediately. |
|
Super Macro |
National Foundations |
Conditions that shape the country’s long-run capacity to grow, innovate, govern, and remain resilient. |
These are the deeper foundations that support future living standards and opportunity. |
|
Super Macro |
Systemic Fragility and External Risk |
Risks that may be less visible day to day but can produce large disruptions if the system weakens or shifts suddenly. |
These are the “slowly, then suddenly” pressures that can change the whole environment. |
|
Macro Channel |
Cost of living squeeze |
Basic necessities take up too much of the household budget. |
When the basics are too expensive, families have less room to save, invest, or improve their lives. |
|
Macro Channel |
Work and mobility breakdown |
Work becomes less reliable as a path to getting ahead. |
The American Dream depends on effort and talent translating into upward progress. |
|
Macro Channel |
Ownership and wealth barriers |
Building wealth, owning a home, and creating financial security become harder. |
Ownership is one of the clearest markers of long-term progress and independence. |
|
Macro Channel |
Family and community strain |
Family life, social stability, and local support structures weaken. |
Strong families and communities are part of both quality of life and long-run resilience. |
|
Macro Channel |
Growth and dynamism slowdown |
The economy becomes less innovative, less productive, and less capable of generating broad gains. |
Long-run improvements in living standards depend on growth that reaches ordinary people. |
|
Macro Channel |
Fiscal and institutional stress |
Public finances and institutions face strain, reducing flexibility, trust, and performance. |
Even good policy becomes harder when the system is financially or institutionally weak. |
|
Macro Channel |
Energy and infrastructure pressure |
Energy, physical systems, and enabling infrastructure become more costly or less reliable. |
These are basic inputs into household life, business activity, and national competitiveness. |
|
Macro Channel |
Strategic and systemic risk exposure |
The economy and society become more vulnerable to global instability, shocks, or structural breaks. |
These risks may build quietly, then have outsized consequences when conditions shift. |
|
Outcome |
Harder to afford life |
Families have less room in the budget after paying for basics. |
This is the most immediate and intuitive sign that quality of life is under pressure. |
|
Outcome |
Harder to get ahead |
Work and effort no longer translate into progress as reliably as they once did. |
This is one of the clearest ways the American Dream breaks down. |
|
Outcome |
Harder to own a home and build wealth |
Ownership, savings, and long-term security feel out of reach. |
Wealth-building supports freedom, stability, and intergenerational progress. |
|
Outcome |
Harder to start and support a family |
Marriage, children, caregiving, and stable family life become more difficult to sustain. |
Family life is central to both quality of life and long-run social health. |
|
Outcome |
Lower quality of life |
Day-to-day life becomes more stressful, less healthy, or less satisfying. |
Quality of life includes more than money. It includes time, health, safety, and peace of mind. |
|
Outcome |
More financial and economic insecurity |
Households become more vulnerable to job loss, illness, inflation, or other shocks. |
Security matters because instability can erase years of progress very quickly. |
|
Outcome |
Fewer paths to move up |
There are fewer accessible ladders into a better job, better life, or stronger future. |
A society with fewer ladders is a society with less mobility. |
|
Outcome |
Kids less likely to do better than parents |
Intergenerational progress slows or reverses. |
This is one of the clearest tests of whether the American Dream is alive. |
|
Outcome |
A weaker future economy |
The nation’s long-run growth, resilience, and opportunity base weaken. |
This shapes what future generations can expect in jobs, incomes, and innovation. |
|
Outcome |
Less trust and shared confidence |
People feel less confidence in institutions, fairness, and the country’s direction. |
Trust helps societies cooperate, adapt, and solve problems. |
|
Outcome |
The Dream feels less attainable |
People increasingly feel that the system does not reward effort fairly or reliably. |
Even if some metrics hold up, belief matters. If people stop believing they can move up, the Dream is weakened. |