Feb 23, 2024
How to read the Official Government Debt Website
There are many Debt Clocks, but if you want the official U.S. government number for the US National Debt, the US Treasury’s Debt to the Penny website is one of the most useful places to start. It is a Treasury dataset that reports the total outstanding public debt each business day and breaks that total into its main components. For readers trying to understand how much the United States owes, how that figure is structured, and how fast it changes, it is the main public source. [1][2]
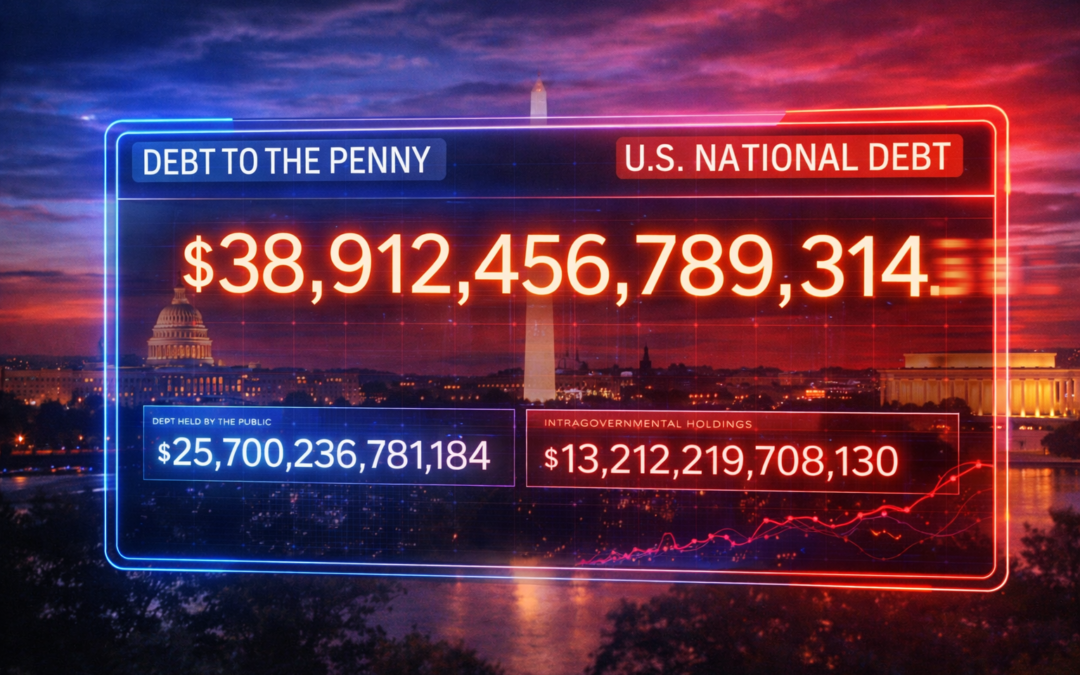
At a basic level, Debt to the Penny answers a simple question: how much debt does the US Federal government have outstanding right now? But what makes it useful is that it does not stop at one giant headline number. Treasury shows the total public debt outstanding and separates it into debt held by the public and intragovernmental holdings. That matters because the top-line debt number is real, but the parts inside it are not all the same thing economically. [1]
Debt to Penny Components
Debt Held by the Public: The first major component is debt held by the public. Treasury defines this as Federal debt held by entities outside the U.S. government, including individuals, corporations, state and local governments, Federal Reserve Banks, foreign governments, and other outside holders. This is the portion of the debt most people usually have in mind when they think about the government borrowing from investors and paying interest to outside creditors. [1]
Intragovernmental Holdings: The second major component is intragovernmental holdings. These are Treasury securities held by government trust funds and other federal accounts. In other words, one part of government is holding debt issued by another part of government. Treasury includes Government Account Series securities in this category, along with Federal Financing Bank securities. [1]
Total Public Debt Outstanding: Add those two together and you get total public debt outstanding, which is the main headline figure on Debt to the Penny. Treasury also notes that this total includes a range of Treasury instruments, including bills, notes, bonds, Treasury Inflation-Protected Securities, floating rate notes, savings securities, State and Local Government Series securities, and other government-related debt instruments. [1]
One source of confusion is terminology. People often say “National debt,” “Federal debt,” or “Public debt” as if they are interchangeable. Treasury itself uses “National Debt” on its public explainer page, while the dataset label is “total public debt outstanding.” For ordinary readers, those are often referring to the same top-line federal debt figure, but it is still useful to know that the dataset has a formal label and that it also separately reports debt held by the public. [1][2]
Debt to the Penny is useful because it is updated frequently. Treasury says the dataset is released daily and updated at the end of each business day using the prior business day’s data. The current series on the dataset page runs from April 1, 1993 through March 19, 2026, with new data expected on the next business day. That means readers can do more than look at a one-time figure. They can track movement over time and see how the debt changes from day to day. [1]
That daily movement is not trivial. At the scale of the US Government, the debt often changes by billions of dollars daily as the government borrows, redeems maturing obligations, rolls over securities, collects revenue, and makes payments. Debt to the Penny is therefore not just a static scoreboard. It is a running measure of a large and active federal balance sheet. Treasury’s broader national debt explainer also notes that the debt has increased every year over the past ten years and points to major drivers such as wars, recessions, and the COVID-19 period. [2] (Treasury’s National Debt Explainer)
Debt Clock Tools
For readers who want the cleanest official answer, Debt to the Penny is the right place to look. However, it is not designed first as a public education tool. It is a Treasury dataset. That means it is authoritative, but it can feel dry if you are trying to grasp scale, pace, and context rather than just pull a number. It basically looks like a set of numbers that you need to interpret. [1][2]
That is where the Tax Project’s Public Debt Clock is useful as an alternative and complement. Tax Project describes its clock as a real-time tracker that shows the national debt, the current budget surplus or deficit, and the interest on the debt. It also adds context by showing debt per citizen, debt per taxpayer, debt as a share of GDP, and comparative scale measures intended to make the number easier to understand and how it relates to you personally. The clock is a way to explore America’s National Debt in real time and see the scope and scale of what America owes. [3][4] (Tax Project Institute Debt Clock)
That distinction matters. Treasury’s Debt to the Penny is the official source. Tax Project’s Public Debt Clock is the more interpretive public-facing tool. One is best for the base data. The other is better for readers who want a faster visual sense of magnitude, related measures, and a more interactive experience. Tax Project’s earlier explainer on debt clocks also notes that these clocks typically use Treasury debt data and simulate movement between reporting cycles so users can see a live estimate rather than wait for the next official update. For example the Debt to the Penny updates daily, but the daily amount changes by billions each day. The Tax Project Debt Clock interpolates based on prior debt to the penny rates of change and use that to calculate a real time estimate. Since the Debt to the Penny generally goes up daily, the value you will see on the Tax Project Debt Clock will most likely be higher as it estimates the daily changes. [1][3][5]
The larger lesson is straightforward. America’s debt is not just a giant number to cite in a headline. It has structure. It has components. It changes constantly. And the public can now see it directly. If you want the official daily debt data, start with Treasury’s Debt to the Penny. If you want more context, more visualization, and more features, the Tax Project Public Debt Clock is a strong companion tool. [1][3][4]
References
[1] U.S. Department of the Treasury, Fiscal Data. Debt to the Penny.
[2] U.S. Department of the Treasury, Fiscal Data. Understanding the National Debt.
[3] Tax Project Institute. Tax Project Debt Clock Launch!
[4] Tax Project Institute. Tools - National Debt Clock.
[5] Tax Project Institute. The Debt Clock.
Feb 17, 2024
Imagine running your household. You earn money (income), spend on essentials (expenses), and sometimes need to borrow for bigger purchases (debt) that exceed your income or savings. The national debt is similar, but on a much larger scale, affecting the entire country. While it is not the same as the US has some other unique features that allow it to potentially borrow more, it acts in the same way.
What is it?
The National Debt is simply the total amount of money the US government owes. It accumulates whenever the government spends more than it collects in taxes and other revenue. It is like using a credit card – convenient in the short term, but the bill comes due eventually and like a credit card the Government must pay interest on the debt in the form of Interest payments, often referred to as Debt service.
Who manages it?
Several key players manage the National Debt:
- The Treasury Department1: They issue debt instruments like Treasury bills, notes, and bonds, borrowing money from investors to raise money “credit” for the Government.
- The Federal Reserve: They play a role in managing interest rates, which affect the cost of borrowing for the government. They set a key borrowing rate known as the Fed Funds rate at which other banks’ rates are set against. As interest rates rise, so does the expense of service the debt, much like credit card companies raising the interest rates for your credit.
- Congress: They authorize the government to spend and borrow money, responsible for managing the debt. Congress holds the purse strings on spending by authorizing spending bills and setting the Debt limit with authorized Debt ceilings.
Who does what?
Several independent agencies track the National Debt:
- Government Accountability Office (GAO): They audit the government’s financial statements and report on the debt.
- Congressional Budget Office (CBO): They provide economic forecasts and analyze the impact of debt on the budget.
- Bureau of the Fiscal Service: They manage the day-to-day operations of the national debt.
- Executive (President of the United States): The President sets the Fiscal Policy, Priorities, and Plan for the budget.
- Office of Management and Budget (OMB): They help prepare the President’s budget, manage the Execution once Congress has approved the budget, and manage the oversight and performance management of the budget.
How does it grow or shrink?
Debt grows when the government spends more than it takes in. This can happen through various scenarios:
- Fiscal Policy: When the President’s Fiscal Policy spends (intentionally or unintentionally) more than the taxes and revenue collected.
- Tax cuts: When taxes are lowered and not offset by the Economic growth from the tax cuts.
- Increased spending: More money on programs like entitlements including Social Security and Medicare or discretionary items like national defense, infrastructure programs add to the debt.
- Economic downturns: When the economy shrinks, tax revenue falls, and the government chooses to borrow to stimulate it instead of reducing spending.
- Exogenous events: Events like the 2008 Financial Crisis, Wars, or the COVID Pandemic can lead to debt spending to address.
The debt shrinks when the government collects more revenue than it spends or through strategic debt payments. Many of these are possible but often not used as they can be politically risky.
- Government Spending Cuts: The Government can reduce spending by cutting or reducing programs.
- Increased Taxes: The Government can increase taxes, although the long-term effects are mixed potentially reducing long-term growth which also impacts taxes collected.
- Economic Growth: While not shrinking the debt, as the Economy grows more taxes are collected. If expenses remain the same, growth will reduce the ratio of expenses to revenue, effectively shrinking the budget.
Where does it fit in with spending and policy?
Fiscal policy is set by the President and refers to how the government manages its spending and taxes. It is a balancing act: providing essential services while keeping the debt under control. Like household credit it must be balanced with the benefits of immediate spending versus the challenges of paying items back later knowing that for every dollar you put on credit you will be reducing your available money to spend because a portion of your income will now go to credit card fees.
“If you choose not to decide, you still have made a choice”
Freewill performed by Rush
Historical context
The National Debt started during the Revolutionary War to finance the fight for US Independence. Since then, it has fluctuated based on several factors like wars, economic recessions, and government priorities.
How is it authorized?
Congress authorizes the government to borrow money by passing legislation, setting limits on the amount of debt allowed, known as the Debt Ceiling. From time to time this limit must be authorized to expand the Debt Ceiling to enable more debt to pay government bills.
The Future?
The National Debt is a complex issue with no easy solutions. Balancing competing priorities, managing interest payments, and ensuring long-term economic stability are key challenges. While there is no magic bullet, responsible fiscal policy, public understanding, and informed debate are crucial for navigating the complexities of the National Debt. The debt burden and interest on the National Debt are very real and left unmanaged can lead to negative consequences to the Economy and our Country.
Feb 17, 2024
The US Economy, measured by its Gross Domestic Product (GDP), represents the total value of all goods and services produced within a year. However, looming over this economic output is the ever-growing shadow of National Debt, raising concerns about sustainability and future generations. This article delves into the comparison between these two figures, explores how recent events impacted them, and examines the challenges posed by a large National Debt exceeding the size of the US Economy.
The National Debt of the United States has been steadily climbing, driven by several factors including fiscal policy, increased spending, and economic downturns. The COVID pandemic significantly accelerated this trend, adding over $7 trillion to the debt, while the roots run deeper. The Great Recession of 2008 also played a major role, pushing the debt-to-GDP ratio above 60% for the first time since World War II. As of Valentines Day 2024, the US National Debt stands at a staggering $34.3 trillion, that’s 34 x 10(12), exceeding 125% of the country’s GDP1.
Inflationary Dance with Debt
This high debt burden intersects with another economic concern: inflation. Increased spending and money supply expansion are often cited as contributing factors to inflation. In 2023, the US experienced inflation rates not seen in decades, exceeding 9% at one point2. While complex and multifaceted, the correlation between debt, money supply, and inflation cannot be ignored3. As Warren Buffett famously said, “Only when the tide goes out do you discover who’s been swimming naked.” Growth in money supply does not automatically mean inflation, but if it outpaces productivity, inflation often follows.
“Only when the tide goes out do you discover who’s been swimming naked.” 4
Warren Buffet
Sustainability Concerns and Interest Bite
Beyond inflation, a ballooning debt raises concerns about its long-term impact. Servicing the debt consumes an increasingly larger portion of the federal budget, diverting resources from crucial areas. The interest on our debt in 2023 reached $659 billion dollars4, to put that in perspective there are less than 40 countries in the World whose entire economy is greater than the interest alone we are paying on our debt5. As interest rates rise, often seen during periods when the Federal Reserve is combatting inflation, interest payments balloon exacerbating the challenge of pay down the debt. Additionally, a high debt can weaken investor confidence, potentially leading to higher borrowing costs and hampering economic growth6.7
“I have yet to see a time when it made sense to bet against America. And I doubt very much that any reader of this letter will have a different experience in the future.”
Warren Buffett
Balancing Act and Looking Ahead
Managing the national debt requires a delicate balancing act. Reducing spending can be politically unpopular, and raising taxes carries economic risks. Meanwhile, relying solely on economic growth for debt reduction is an uncertain strategy. Finding a sustainable path forward necessitates responsible fiscal policy (spending within our means) and bipartisan cooperation, both of which remain elusive in the current political climate.
However, as Warren Buffett has bullishly stated: “I have yet to see a time when it made sense to bet against America. And I doubt very much that any reader of this letter will have a different experience in the future.”
While expressing confidence in the long-term potential of the US economy, acknowledging the need for responsible debt management remains crucial.
Feb 12, 2024
Imagine, you negotiate a raise at work, feeling a sigh of relief knowing your pay will finally outpace your expenses. But wait, the grocery bill is steeper, gas prices are soaring, and now even your morning coffee feels like a luxury. Did your raise suddenly lose its bite? Welcome to the hidden world of inflation, where prices silently rise, eroding your purchasing power like a phantom tax.
What is Inflation?
Inflation, simply put, is the sustained increase in the general price level of goods and services in an economy, often measured by the Consumer Price Index (CPI)1. Since the start of the pandemic in 2020, the CPI has climbed dramatically, not just reaching a peak of 9.1%2 in June 2022, but cumulatively increasing by over 18% between January 2020 and December 2023.3 This means a product costing $100 in 2020 might set you back $118 today – a noticeable difference that adds up quickly across all your purchases.
But what fuels this price rise? One significant factor is the money supply, which refers to the total amount of money circulating in an economy. Governments can increase the money supply by “printing money,” essentially injecting new cash into the system. This might sound like a quick fix, but it can lead to devaluation of existing currency if the increase outpaces genuine economic growth.
Role of Federal Reserve
In the case of the US, the Federal Reserve (Fed), the central bank of the US, plays a significant role in this process. Since the start of the pandemic, the Fed increased the money supply by a staggering 40%4, aiming to stimulate the economy during the downturn. While this measure may have achieved its immediate goal, it also contributed to the current inflationary pressures.
Risks of Inflation
The risks of excessive money printing are not merely theoretical. Countries like Venezuela, Zimbabwe, and the Weimar Republic in Germany serve as stark reminders of the devastating consequences of runaway inflation.5 The US is not close to the conditions in which these countries experienced HyperInflation, and has unique economic advantages over these countries, however we are not immune. When Money Supply grows faster than Economic Output, inflation follows.6 The massive injection of money by the Fed increases those risks.7 Ratings agency Fitch recently downgraded the US credit rating, meaning they perceive higher risks investing in the US dollar, yet it remains the most stable currency globally.8
Is Inflation a Tax?
So, is inflation a tax? In a traditional sense a tax is an obligatory contribution placed directly on the population, so the simple answer is no. However, “to tax” meaning “to burden, or put strain upon” certainly applies and therefore in a broader sense many argue it is. Governments have two ways to raise money, they can either Raise Taxes or Print Money. Raising taxes is unpopular and for elected officials this is politically risky to have an angry constituent, but Printing Money is indirect, nobody sees it coming out of their pocket but it comes with inflation that is no less real. This “hidden tax” silently reduces the value of your savings and income, impacting everyone from retirees living on fixed budgets to families struggling to afford necessities and whether you are wealthy or poor nobody is immune. Since 2020, wage growth has lagged behind inflation, meaning your paycheck buys less even if the number on it is higher.
Regardless of your perspective, the impact of inflation is undeniable and during periods of high rapid inflation the average American can really see it and feel it. It disproportionately affects lower-income individuals who spend a larger percentage of their income on essentials. While some asset holders might initially gain as investment prices rise, inflation can erode the value of their savings in the long run.
What do you think? Does inflation feel like a stealthy tax impacting your daily life? Do you believe policymakers should prioritize other options over printing money, even if it means less popular decisions like raising taxes?
Ultimately, understanding inflation empowers us to make informed decisions. By keeping the conversation open and questioning the underlying forces at play, we can work towards a more stable and prosperous economic future for all.